
Earlier this year, I wrote about the declining number of early-stage venture deals and in the number of startups entering the venture-backed pipeline in the United States. As I think about the overall health of American entrepreneurship, this development raises some questions. Is the early-stage decline driven by factors on the supply-side (investors) or the demand-side (startups)? Or is it both? Does it reflect an overheated market simply returning to normal, or are other factors at play? As one example, is this evidence of winner-take-all markets, whereby fewer startups get funded, but those that do raise ever more capital? Is it something else? Is it all of these things? And, should this concern us?
These are thorny issues that are really hard to answer. I've been asking some really smart people—from founders to investors to academics—what they think, and there doesn’t seem to be a straightforward explanation for the early-stage retreat the last few years. I don't have one either, but I do have some interesting data points worth sharing that help advance our collective understanding and may partially suggest what’s going on.
Here are the key takeaways of the analysis I’m about to present:
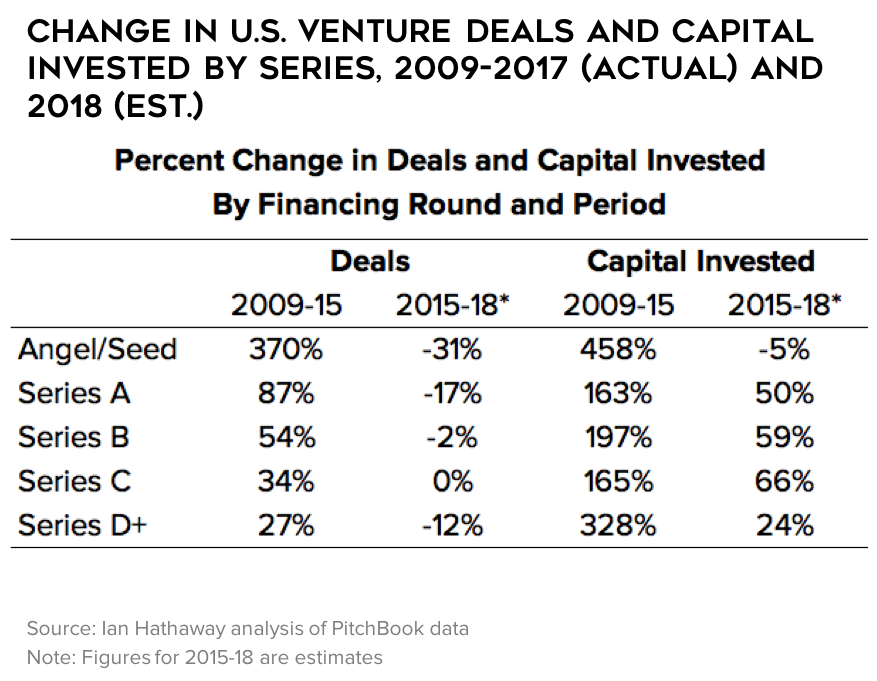
There are fewer deals at the early stages, especially at the Angel/Seed stage but also at Series A. The number of financings at Series B and C are about flat, and for Series D and later, the volume of deals has also come down.
Deals may be down, but the amount of capital deployed is going up as companies that do get funded are taking on much larger amounts of capital—this is true across each individual stage (round sizes) and cumulatively over the lifecycle (total equity invested). This trend has been most pronounced at Angel/Seed and Series A.
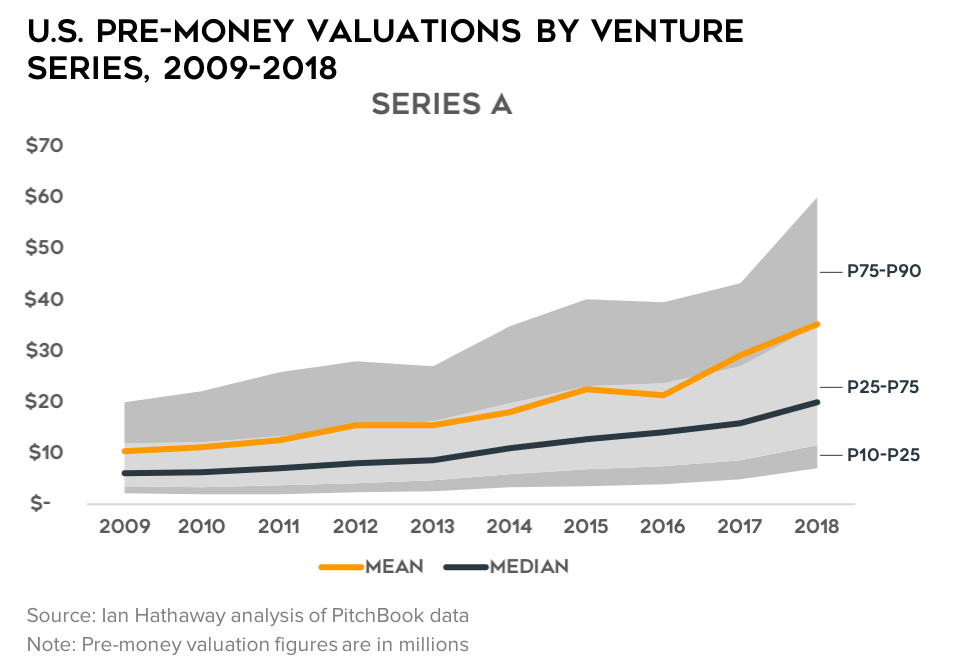
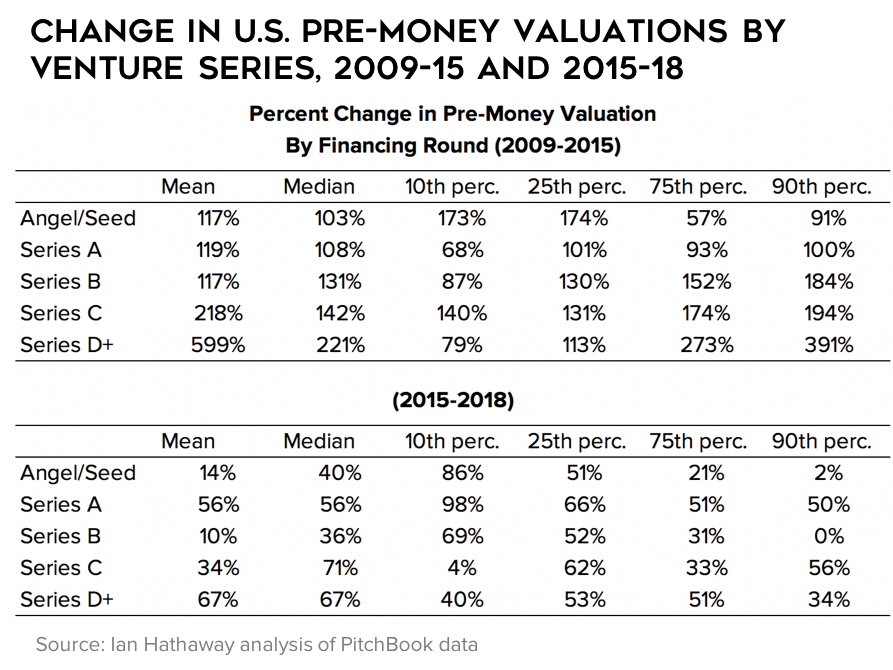
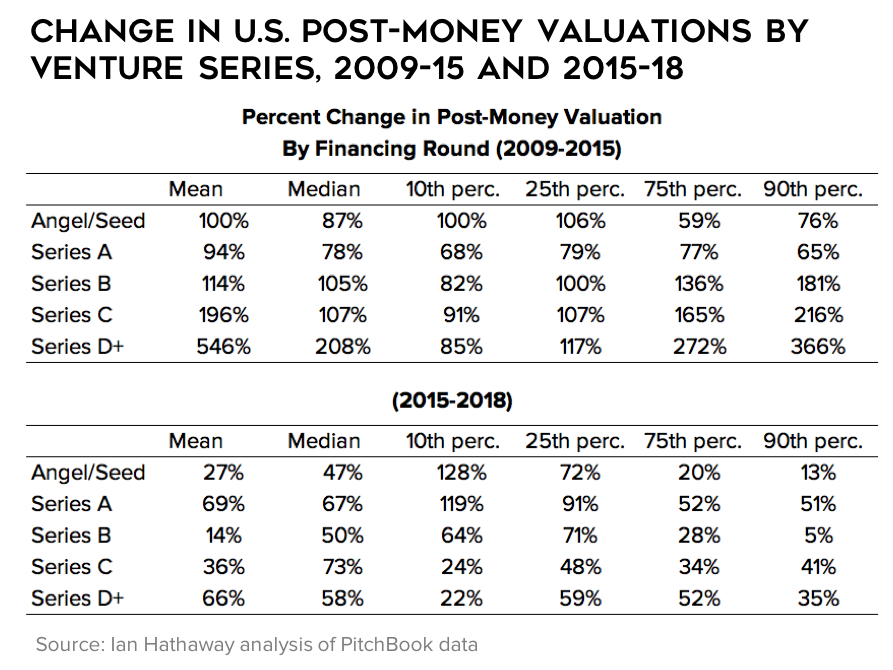
With more capital being raised, valuations have unsurprisingly been increasing too—with the most growth at Series A and from Series C onward. The least amount of growth in valuations has been at the Angel/Seed stage and at Series B.
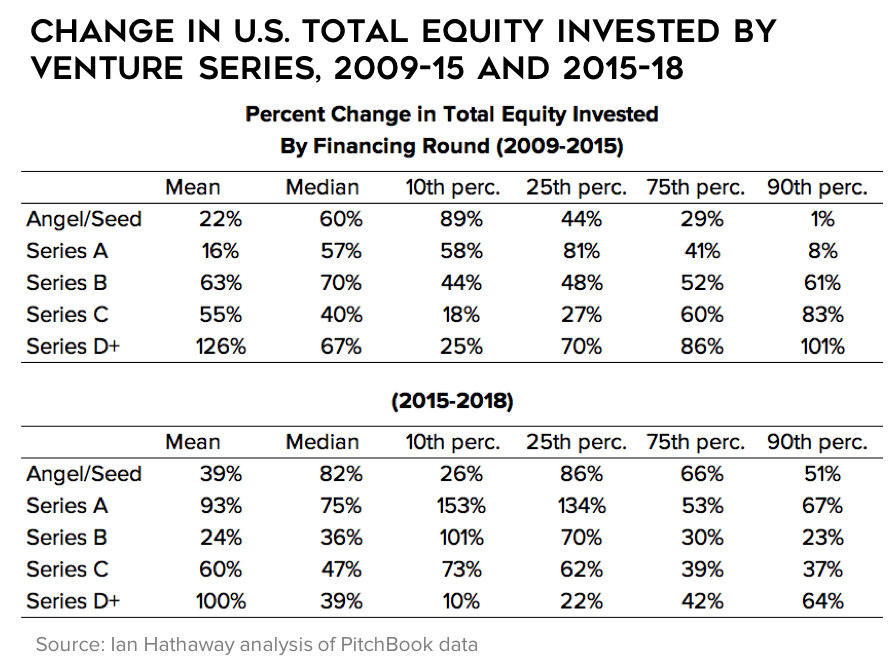
However, these figures have not expanded equally—capital raised has grown more rapidly than have valuations. This means that the equity stake taken by investors is going up while valuation multiples (a rough proxy for investment return) are coming down. In other words, every dollar that investors put into a startup today nets them a bigger slice of the pie than it did a few years ago. Similarly, for a given valuation threshold, companies have to raise more money—and give up more ownership—than they did in the past.
These trends in valuation multiples and ownership stakes are not occurring across all rounds—in fact, they are occurring only slightly for Series B and C and not at all from Series D+. However, at the early-stage—especially at the Angel/Seed stage—these trends are dramatic. I would describe valuation multiples at Angel/Seed as in an outright collapse since 2015, and down meaningfully for Series A.
It’s unclear what this all means, but it feels significant. At minimum, it signals to me that the early-stage calculus has changed in recent years—fewer startups are raising more capital, but investors are commanding a larger stake, even as valuations have gone up. This could be for a number of reasons, including a genuine pullback in the market or the sheer necessity for investors to obtain larger stakes early on as ever-larger rounds dilute those positions in the future. Either way, early-stage founders are taking on more money, investors are giving it to them, and in exchange, they’re getting a larger piece of the pie.
It also signals to me that a downshift in the number of companies entering the venture-backed pipeline compared with a few years ago is here to stay. From a capital efficiency standpoint, that is a good thing—the Angel/Seed funnel widened more so than follow-on investors could sustainably accommodate. That doesn’t mean another, more permanent expansion won’t occur in the future, but for now, I believe we’re reaching a new normal—well up from the 2000’s but about a quarter to a third below the 2015 peak.
Fewer Early-Stage Deals, More Capital Deployed
First, let’s recap. The below set of charts shows activity of venture deals and capital invested annually from 2009 through the present (figures for 2018 are estimates, since the year is not completed). The deals are broken down by five round stages: Angel/Seed, Series A, Series B, Series C, and Series D or later (Series D+).
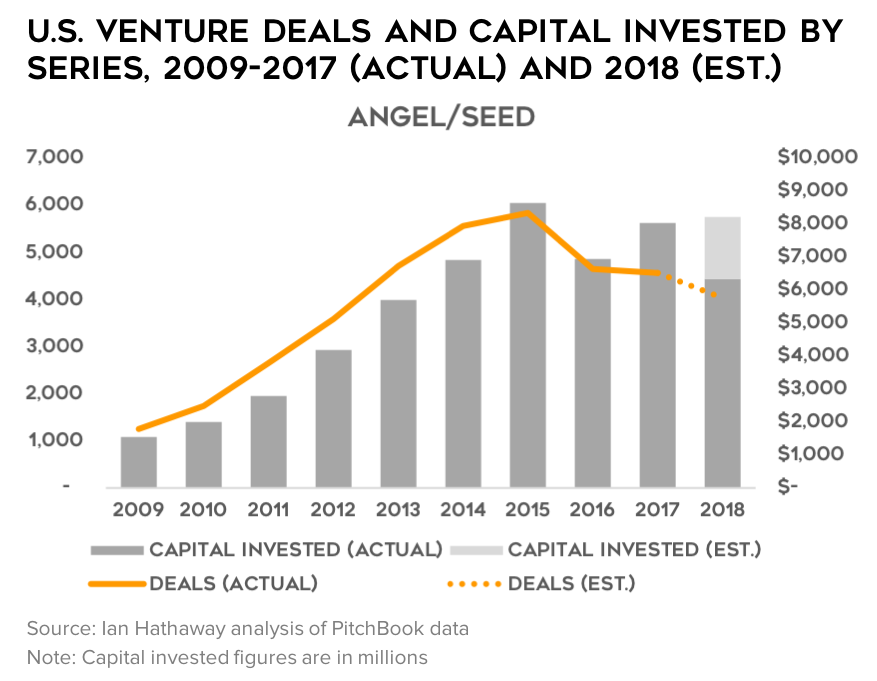
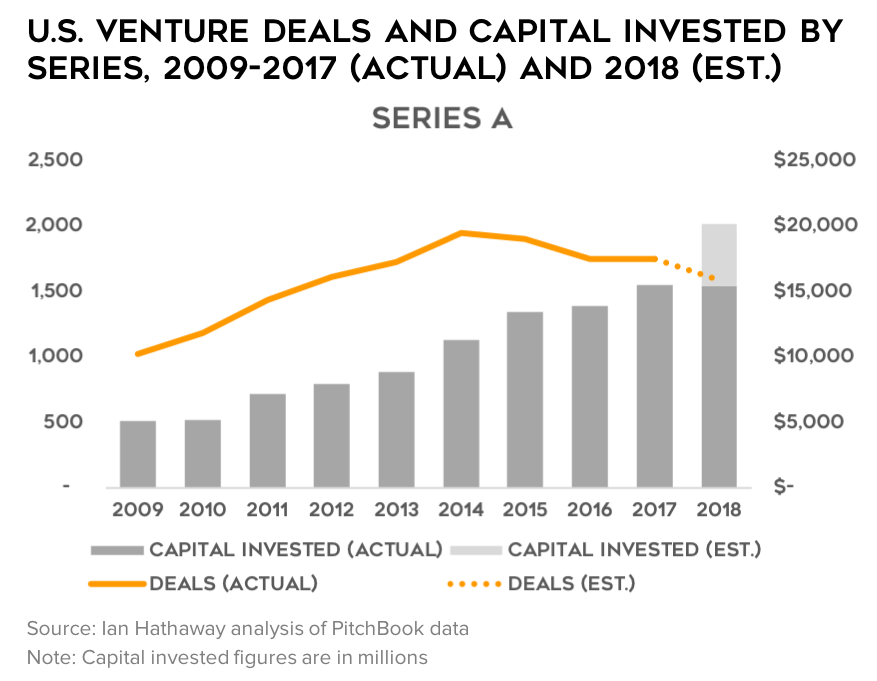
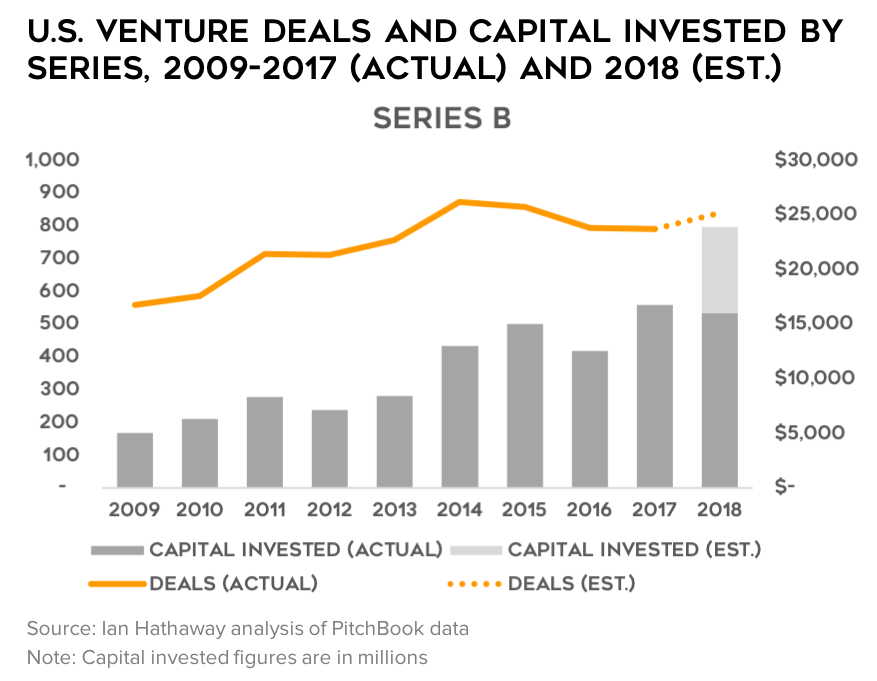
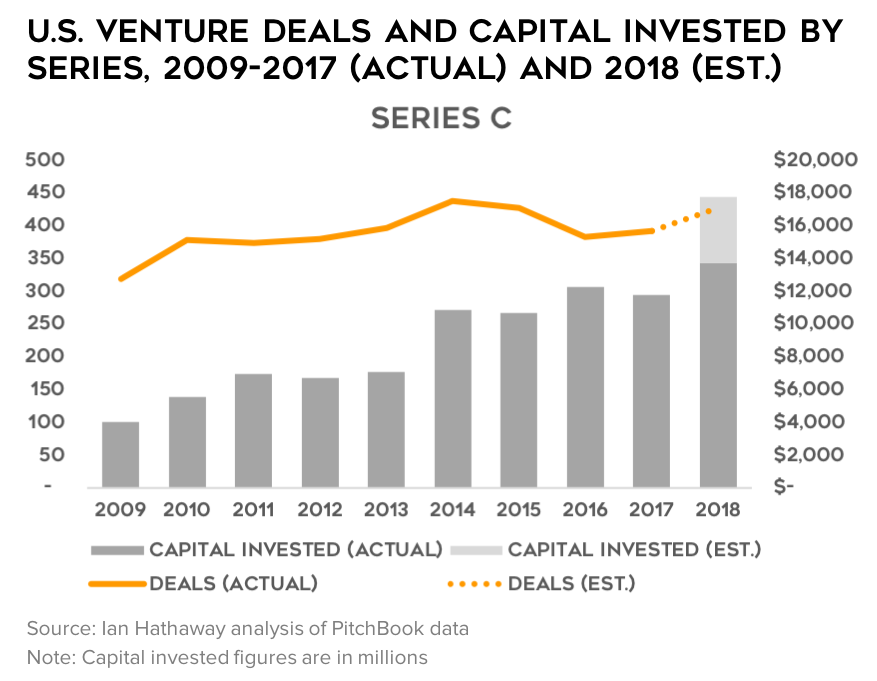
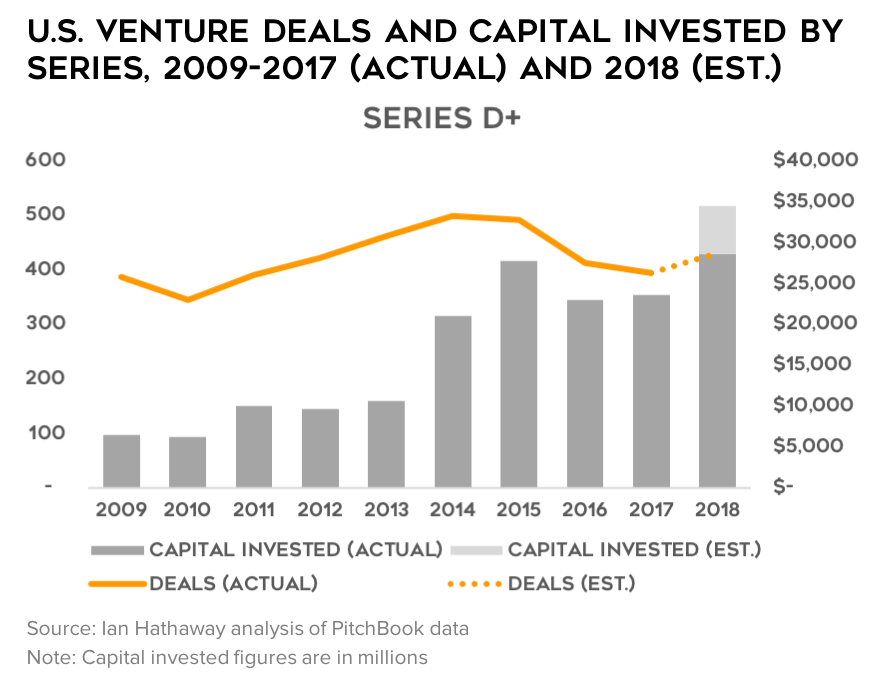
The short of the long of it is this: after a steady boom in companies getting funded at the Angel/Seed stage, and to a lesser degree at Series A, following the Great Recession, the number of such deals declined sharply after 2015. For Series B and C, deals have been about flat or down slightly, and from Series D onward deals are also down after peaking in 2015. However, in each case, the amount of capital deployed in such deals has grown noticeably, or at worst has been about flat from the peak (Angel/Seed only).
Larger Deals and More Capital Invested
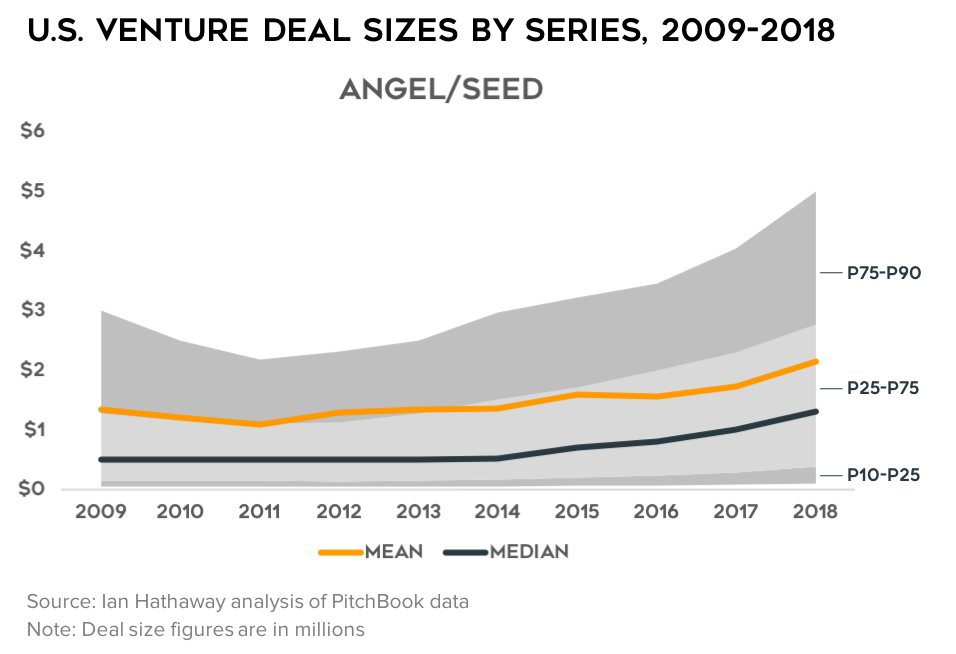
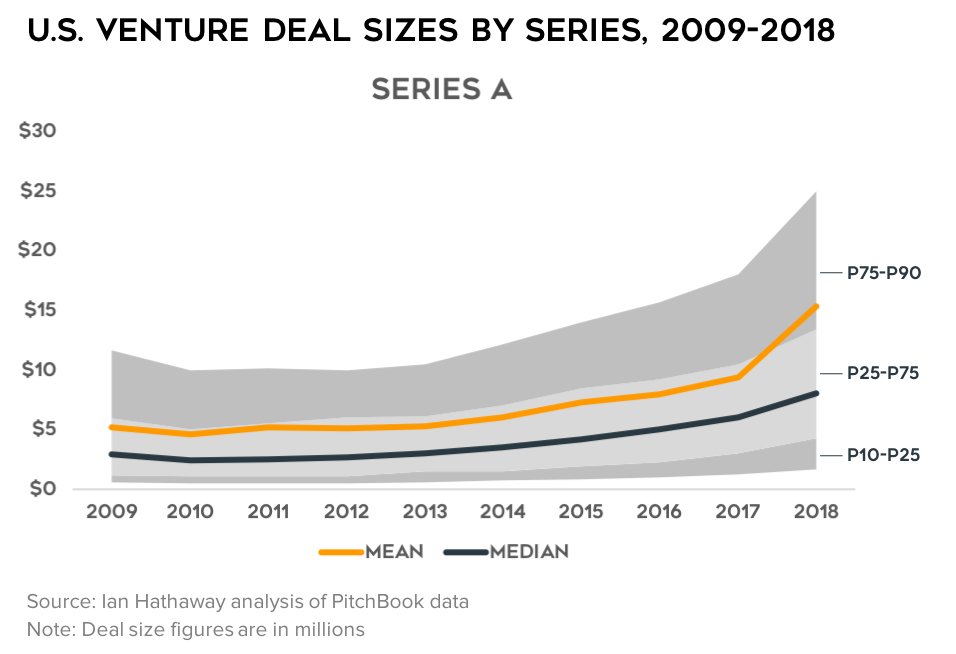
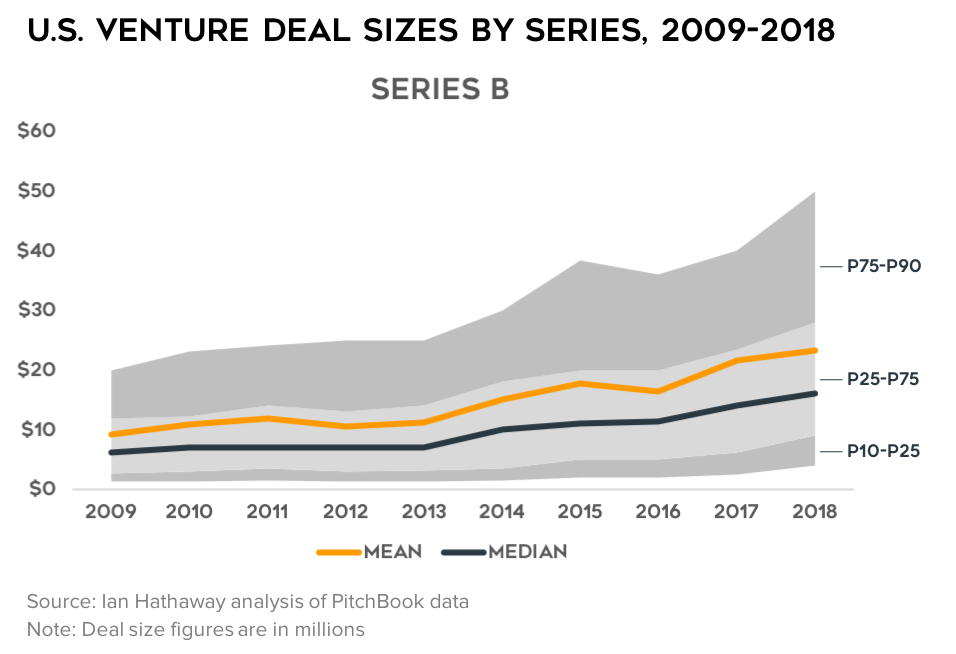
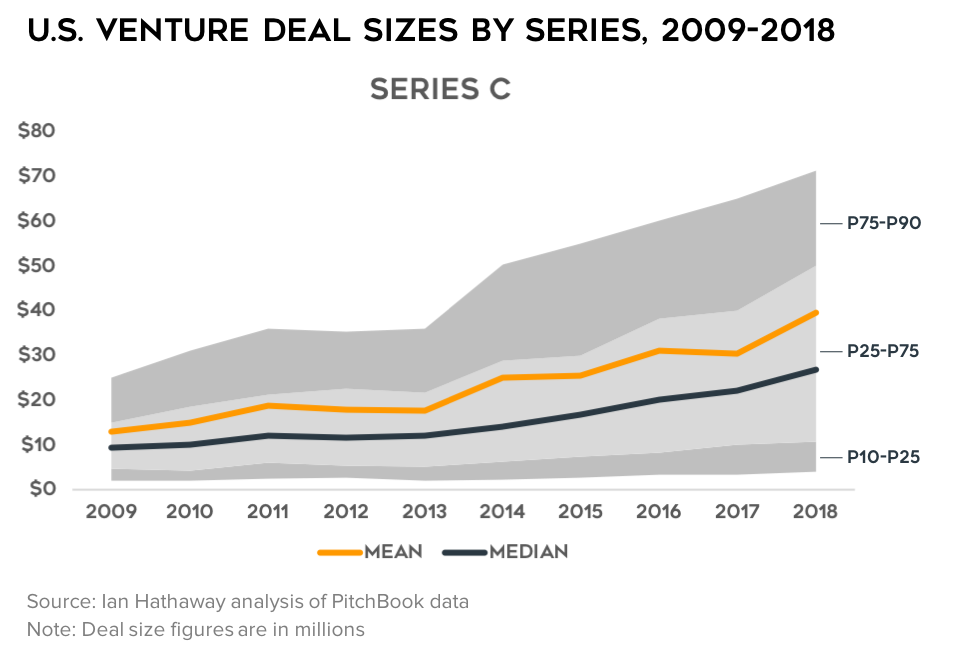
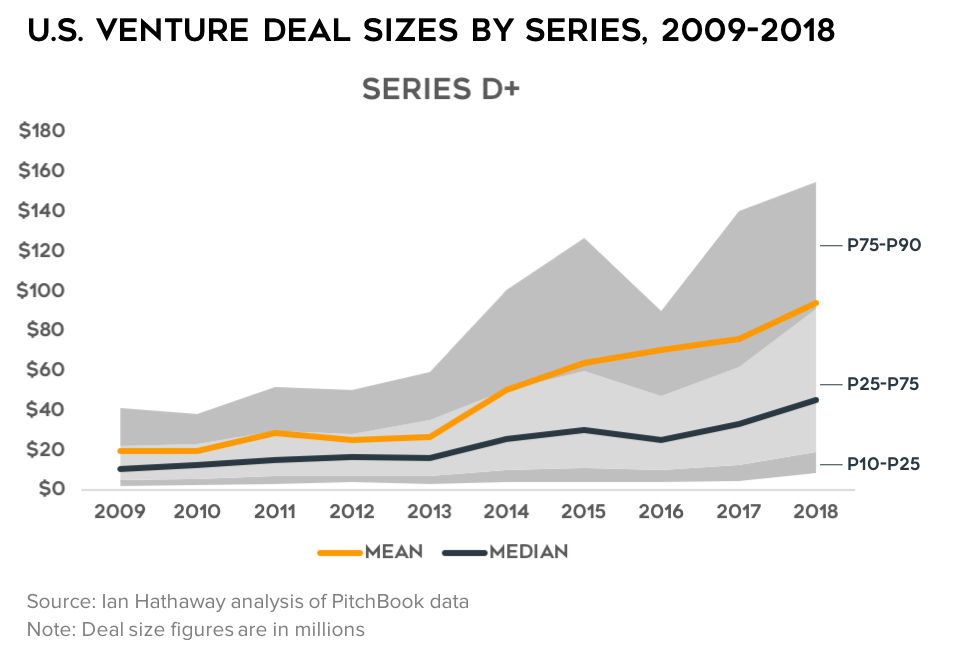
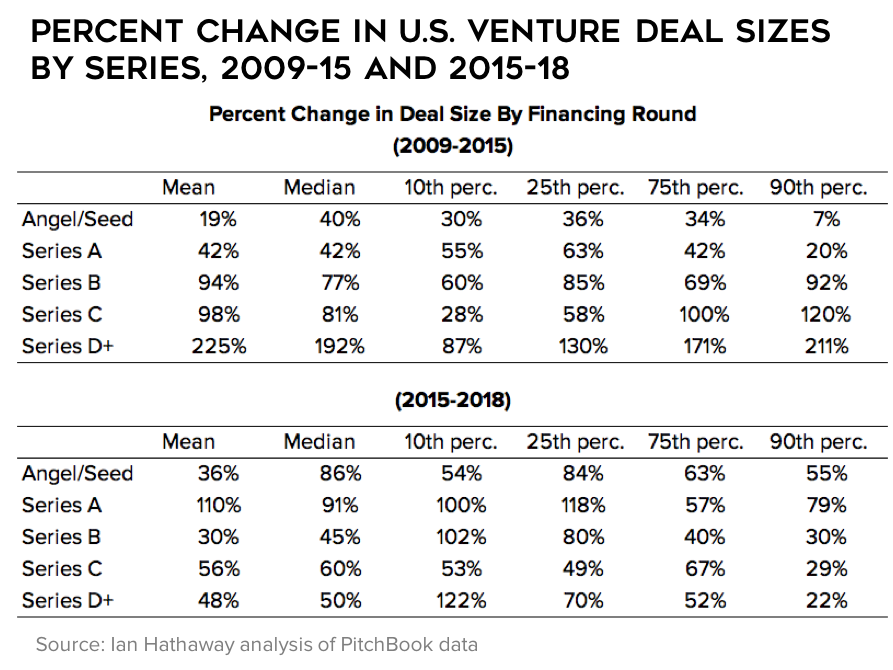
If fewer (early-stage; later-stage) or the same number (middle-stages) of companies are getting funded and the amount of capital being deployed is going up, then of course that means companies are raising more capital. To begin, we see deal sizes at each round by various statistical distributions—the average (mean), median (50th percentile), and bands for percentile ranges (10th-25th, 25th-75th, and 75th-90th). As the data show, deal sizes are up across each series, but up the most at Series A, followed by Angel/Seed.
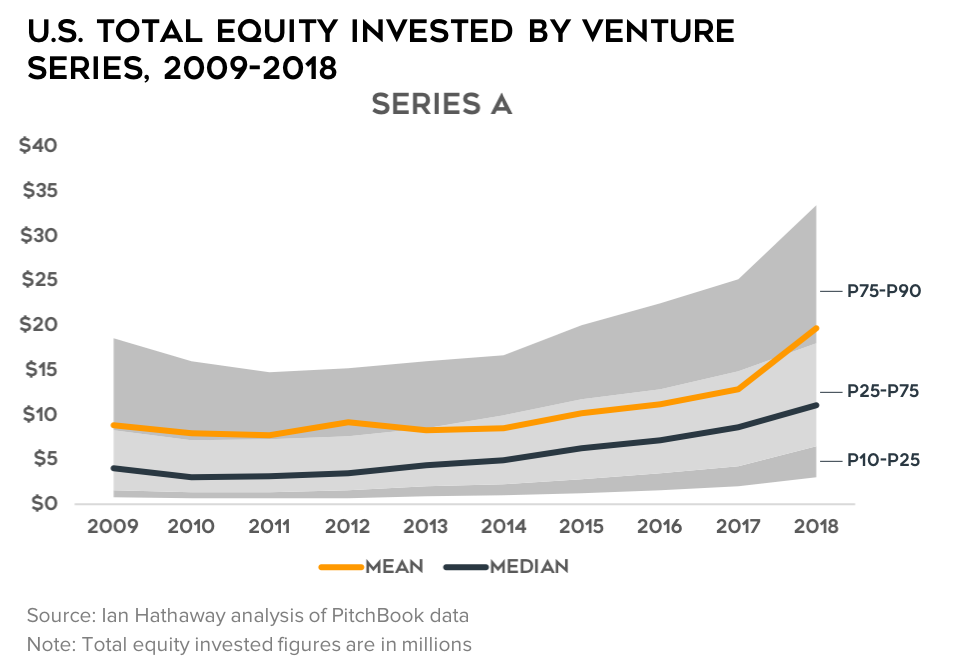
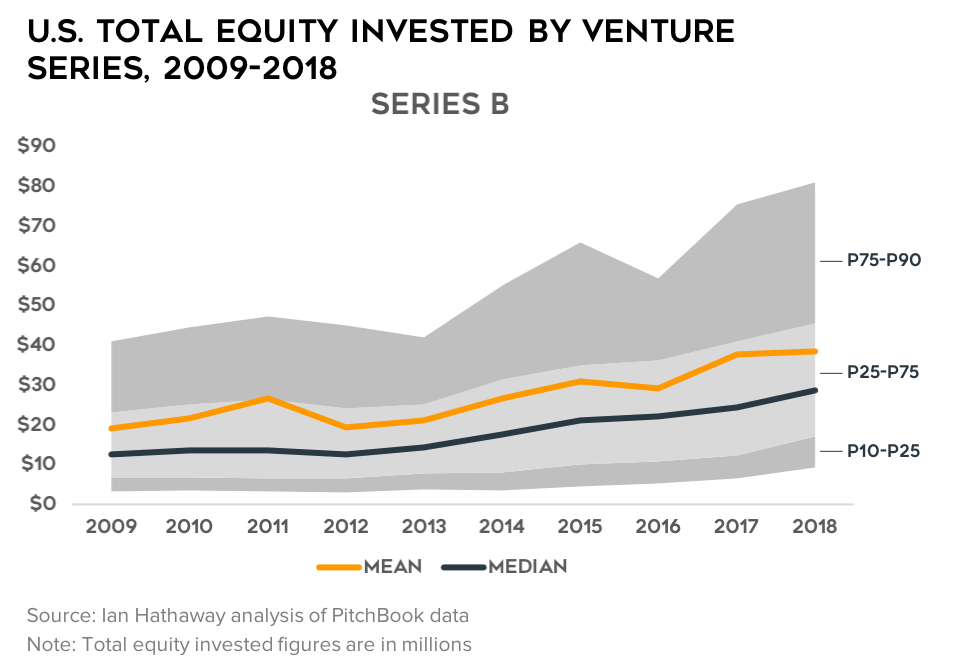
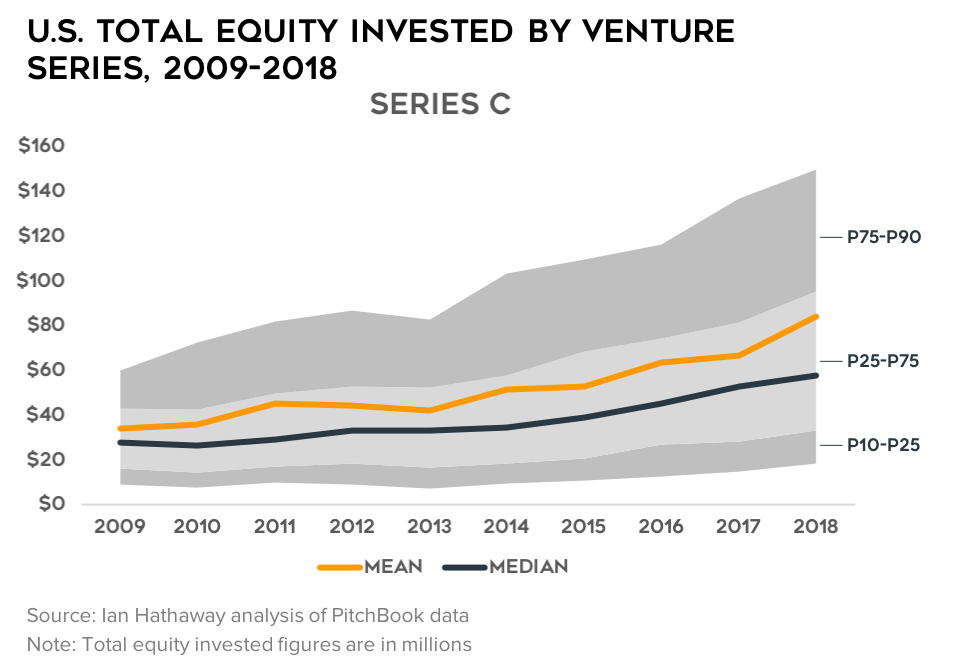
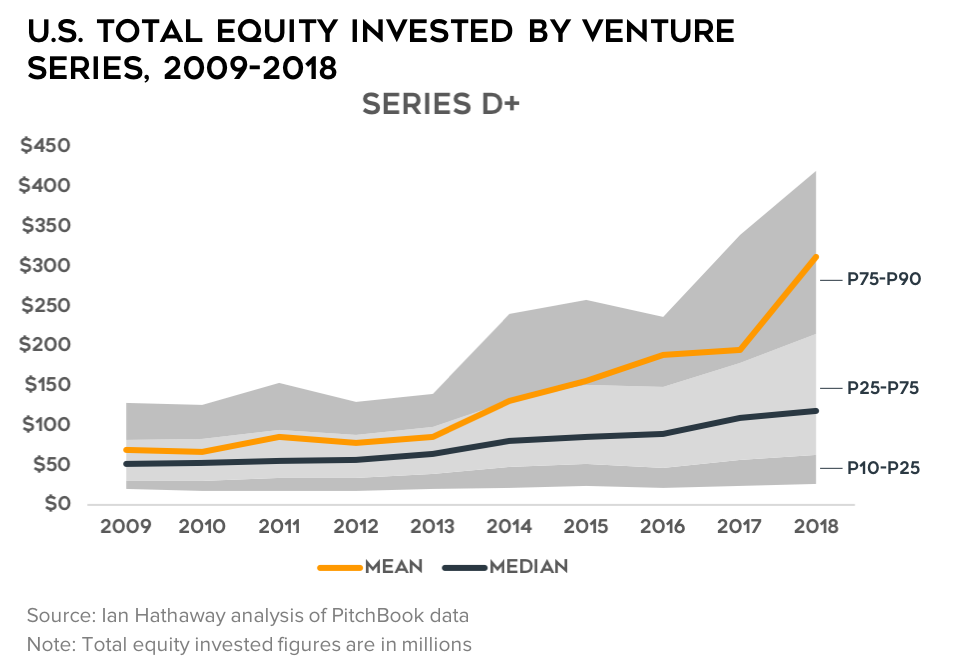
These larger rounds of capital build on one another as companies move into additional rounds of fundraising. The charts below show the statistical distributions for total equity raised (cumulative) through each round (Angel/Seed through Series D+), demonstrating a similar pattern—capital invested is up across each series, and the aggregate increases are being driven at the high end of the distribution (as demonstrated by the average being well above the median, and typically around or greater than the 75th percentile).
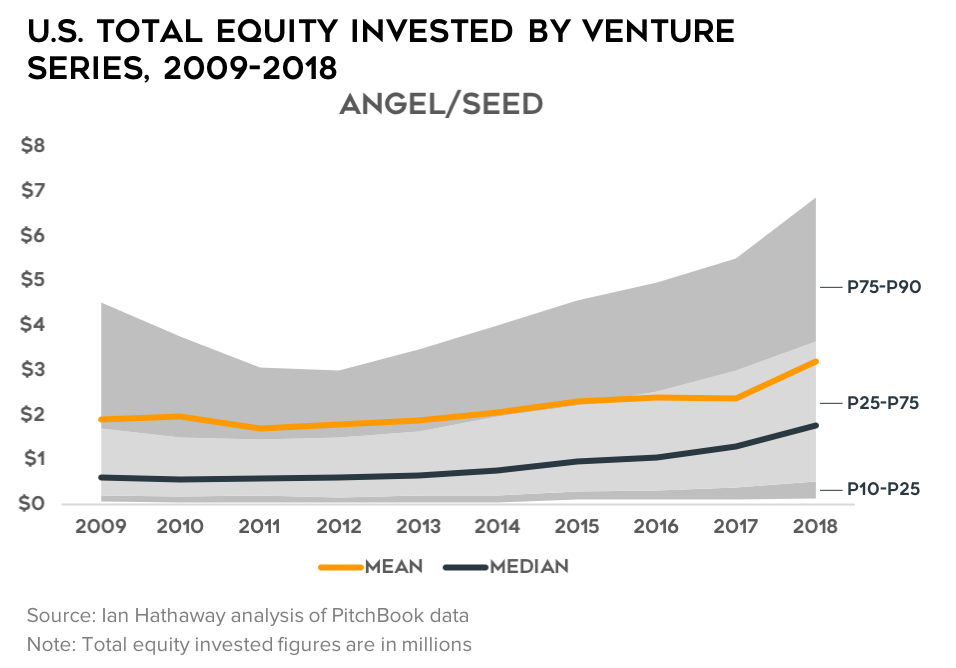
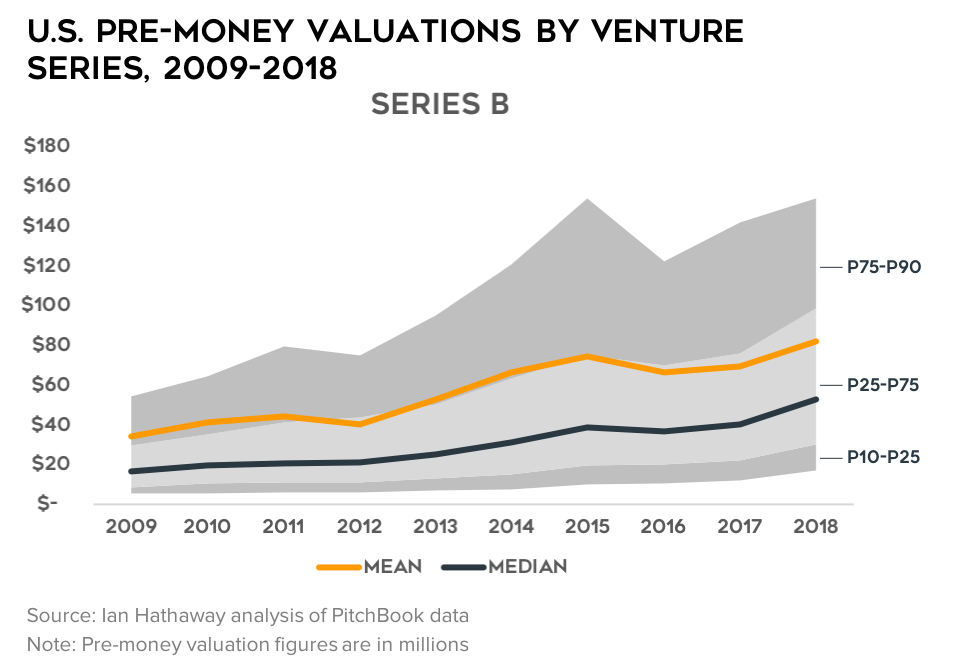
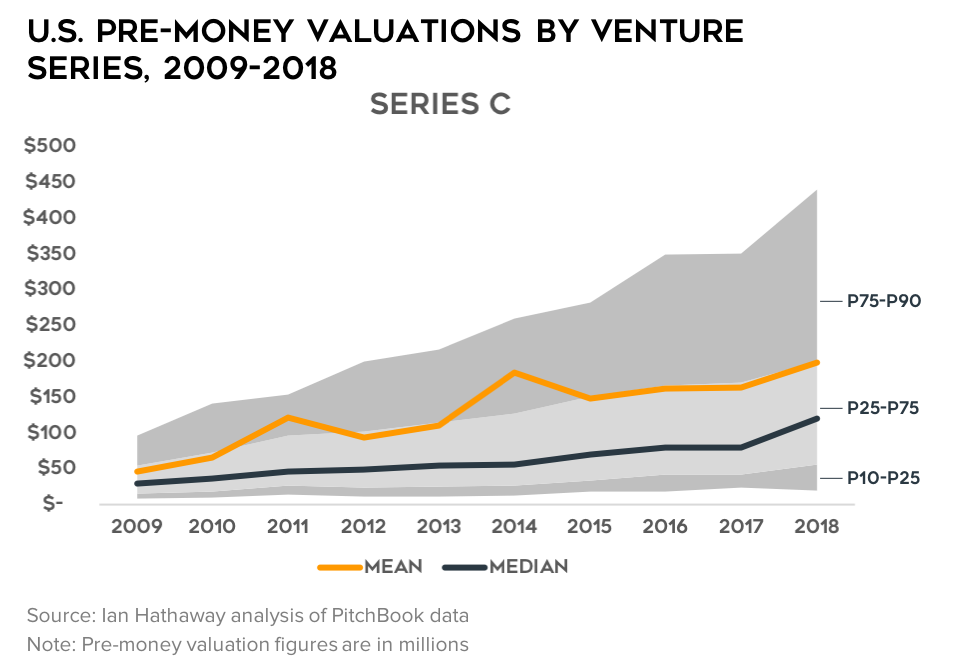
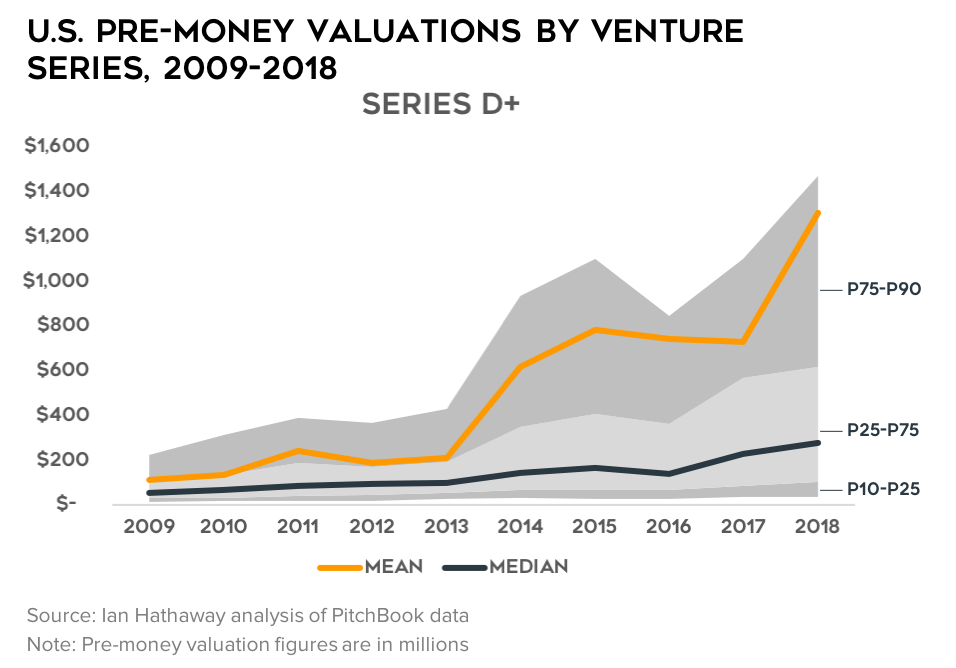
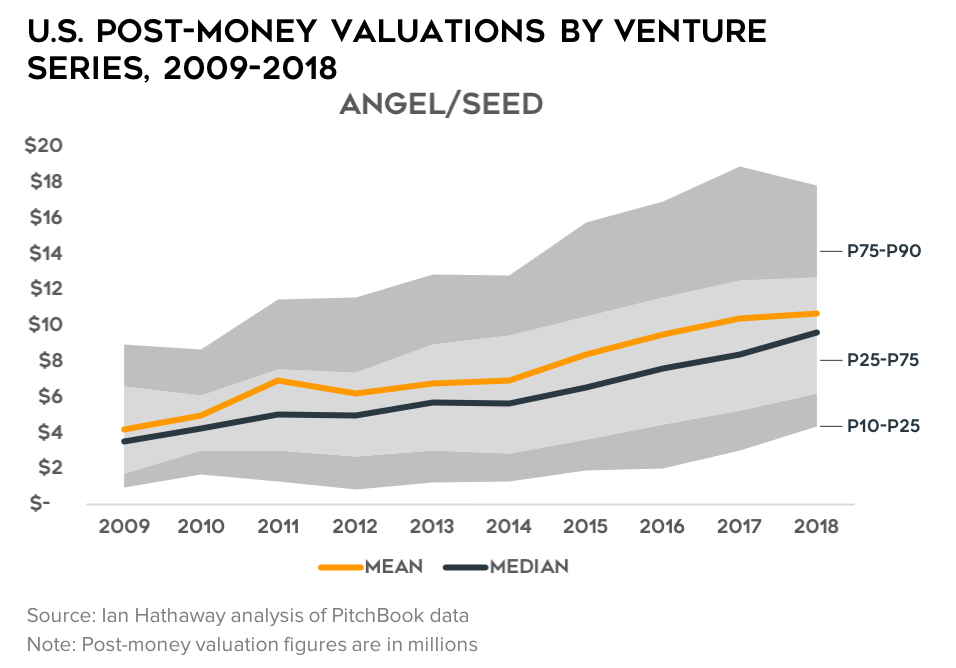
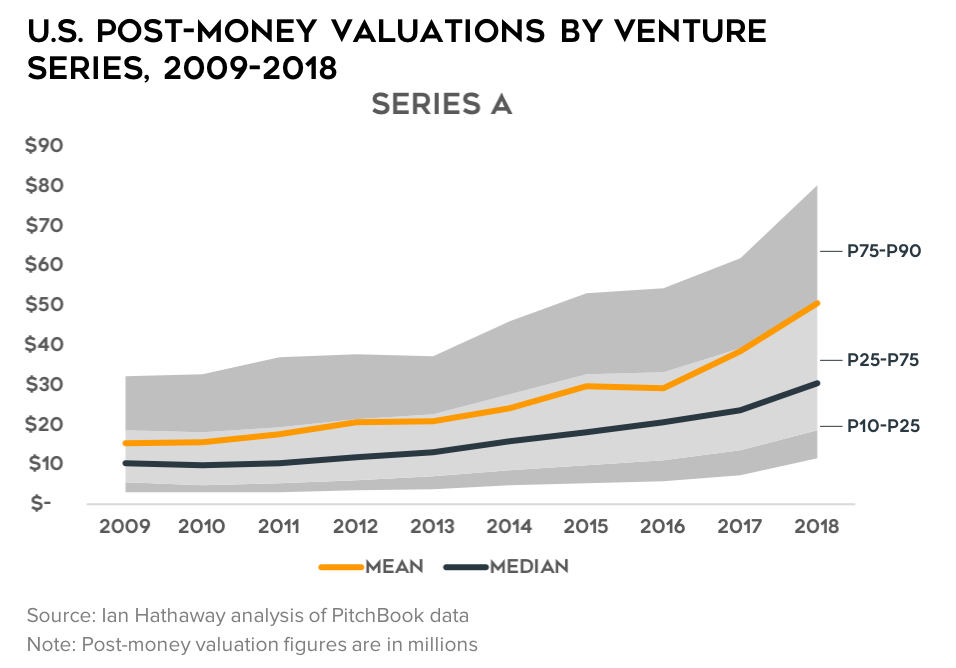
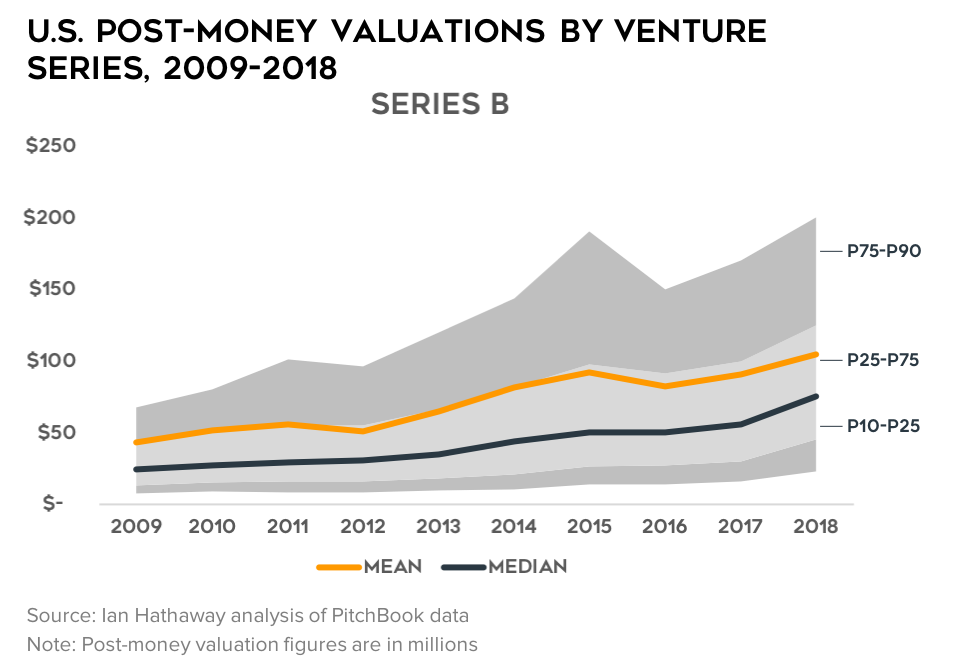
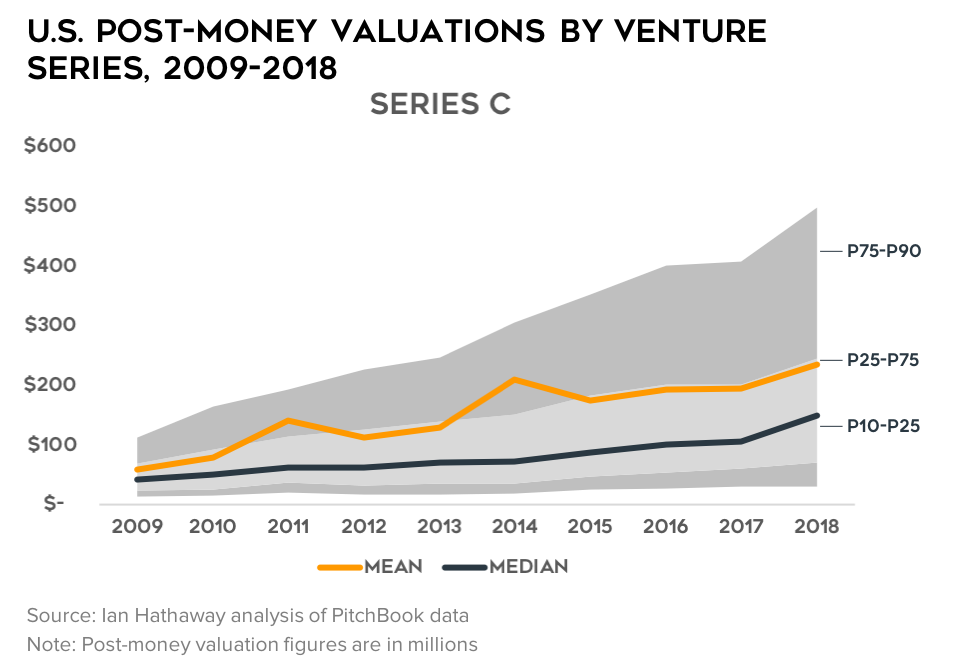
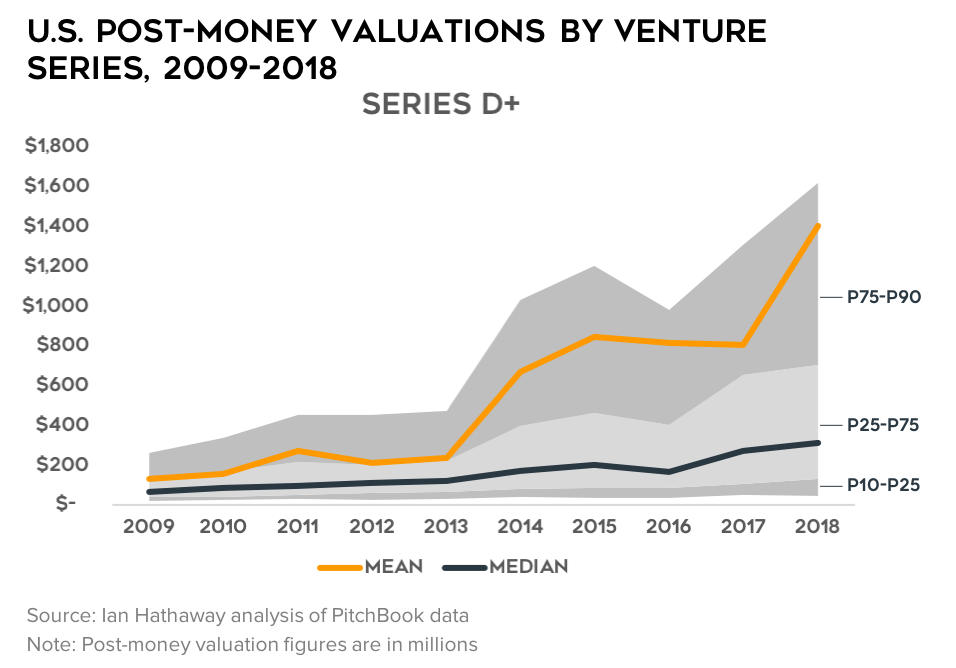
Valuations are Going Up Too
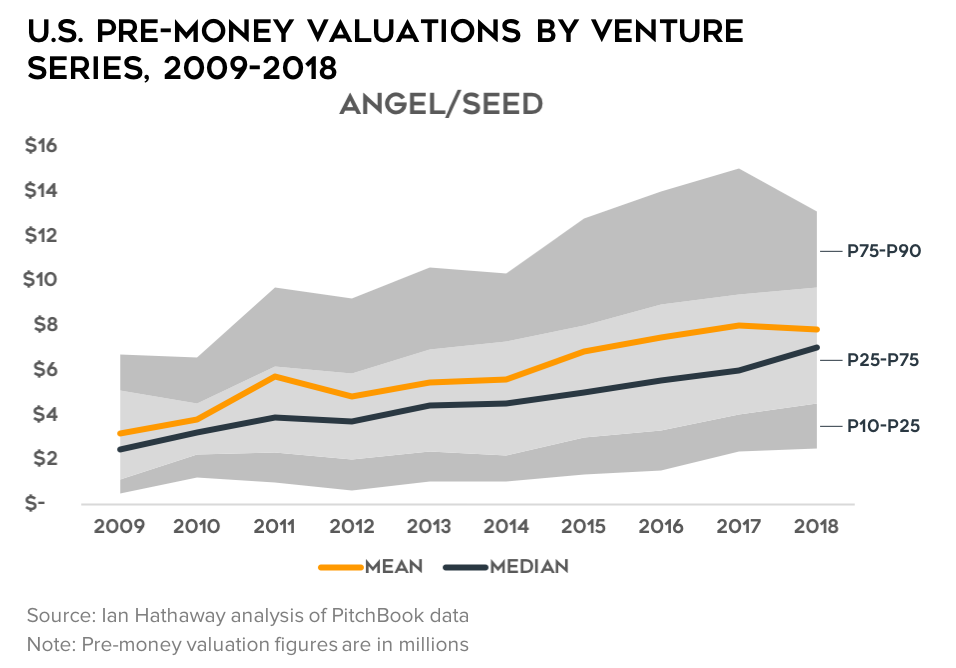
A very similar trend is observed among each venture series for valuations (pre- and post-money), with company valuations increasing across the board. Generally speaking, here too valuations are increasing the most at the top of the distribution (which is pulling up the average), except for at the Angel/Seed stage, where the distribution of valuations actually tightens a bit in the last couple of years.
Early-Stage Valuation Multiples Have Collapsed
The data we’ve seen so far have been pretty well advertised—fewer companies getting funded, but those that do raising ever more capital and reaching higher valuations. But, the simple fact is that valuations aren’t growing as fast as is capital raised at the early stages—especially at Angel/Seed but for Series A as well. As a result, valuation multiples (post-money valuation over total equity raised) are collapsing at the early-stages.
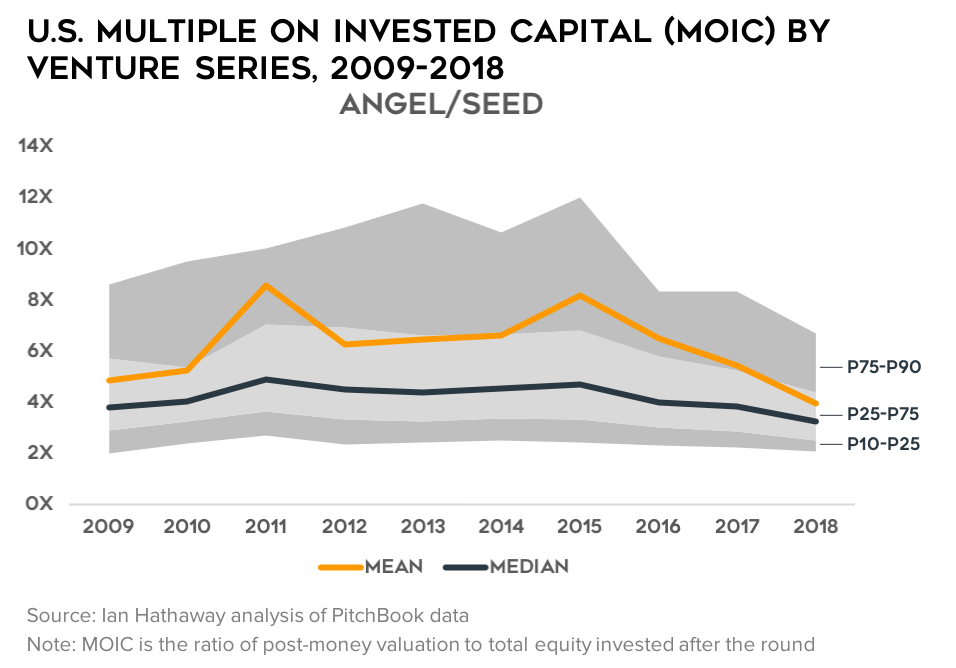
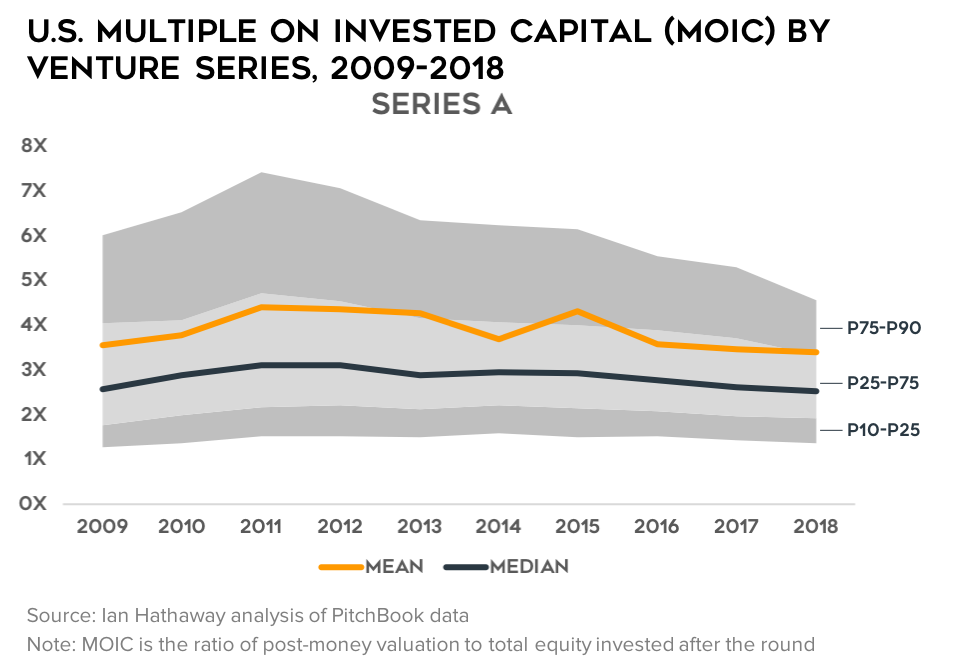
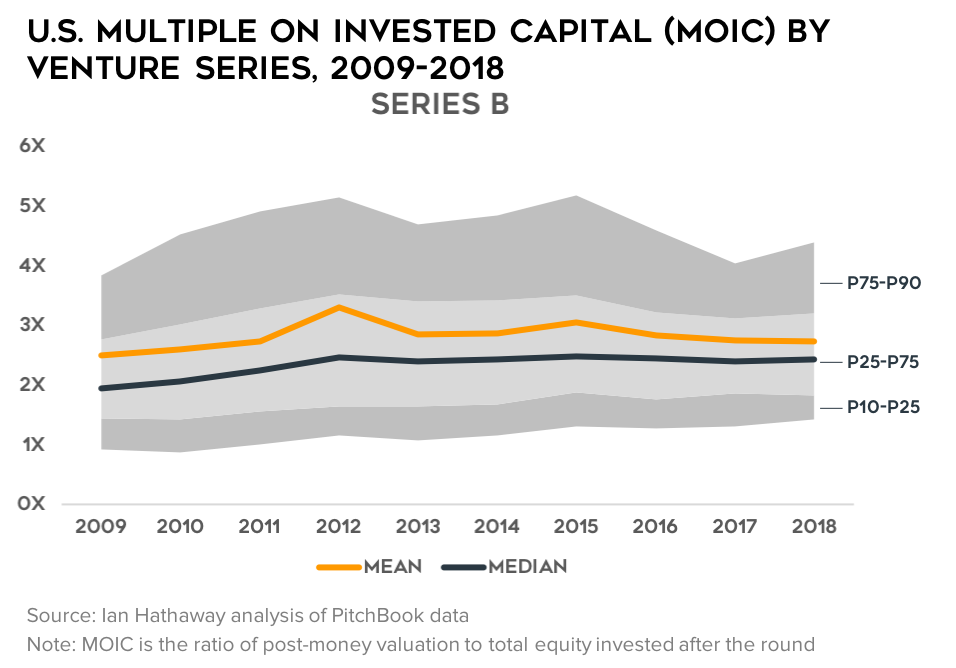
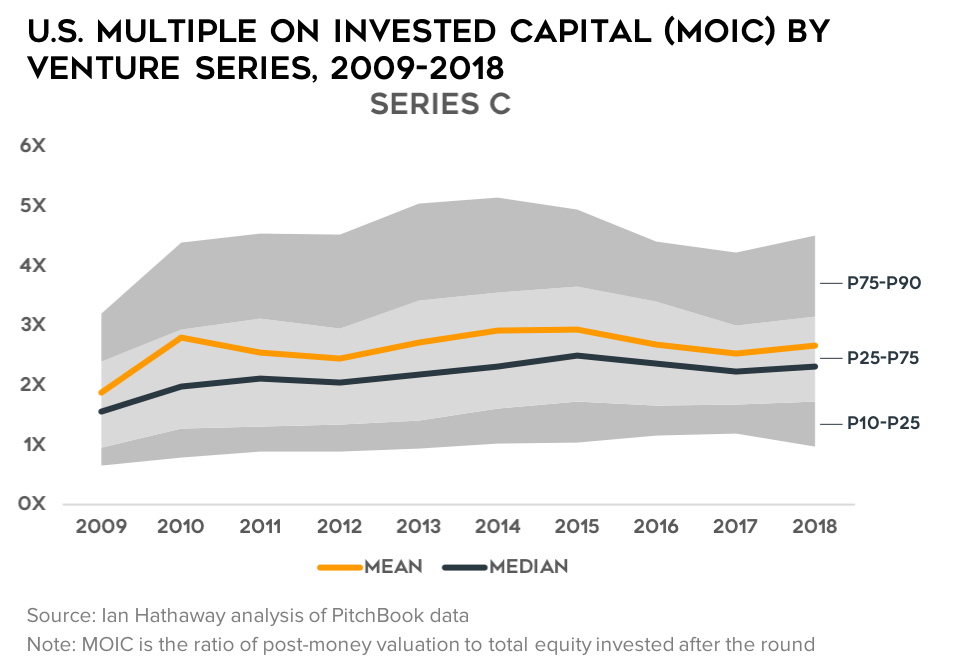
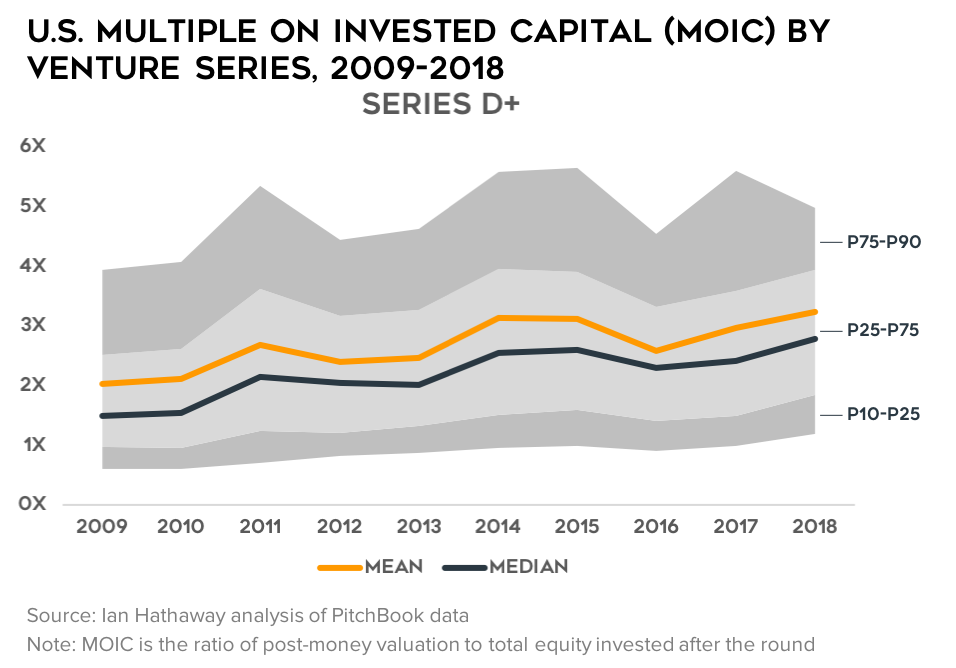
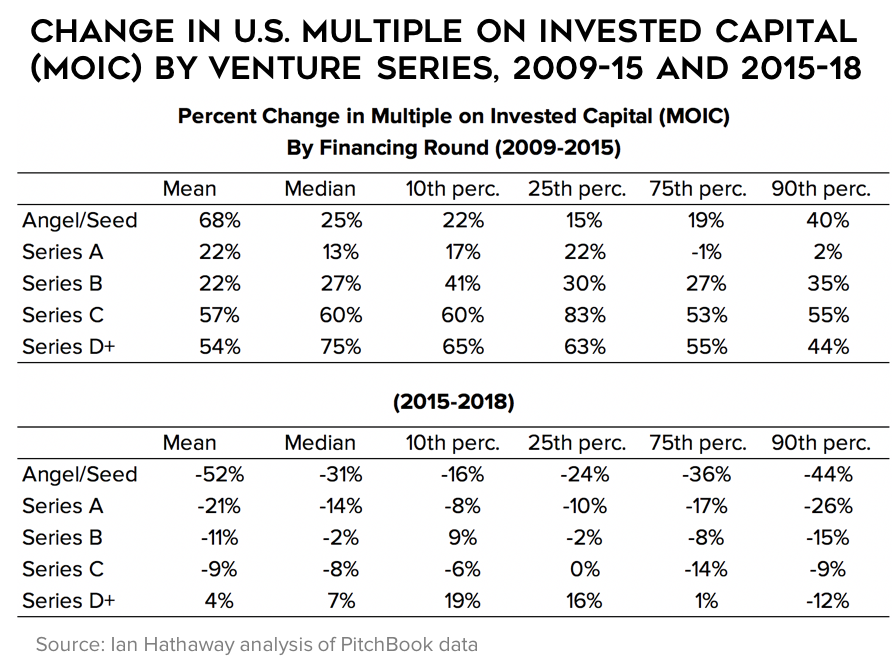
As the data show, this is only the case at Angel/Seed and Series A. Valuation multiples at Series B and Series C have held mostly flat to increasing slightly, and at Series D and beyond, they’re actually beginning to accelerate upward again.
Early-Stage Investors are Taking a Larger Stake
Given that capital invested is growing at a faster pace than are company valuations, the simple math tells us that investors are garnering a bigger stake in companies at the early stages (note: it’s likely that valuations are down because investors are taking a bigger stake; not the other way around). Sure enough, that’s what the data show.
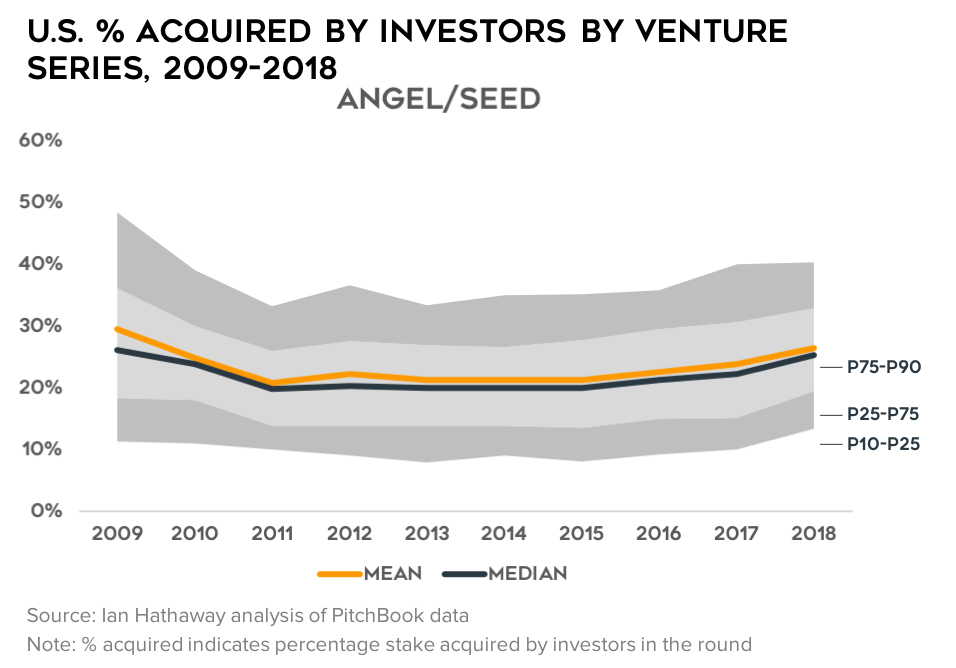
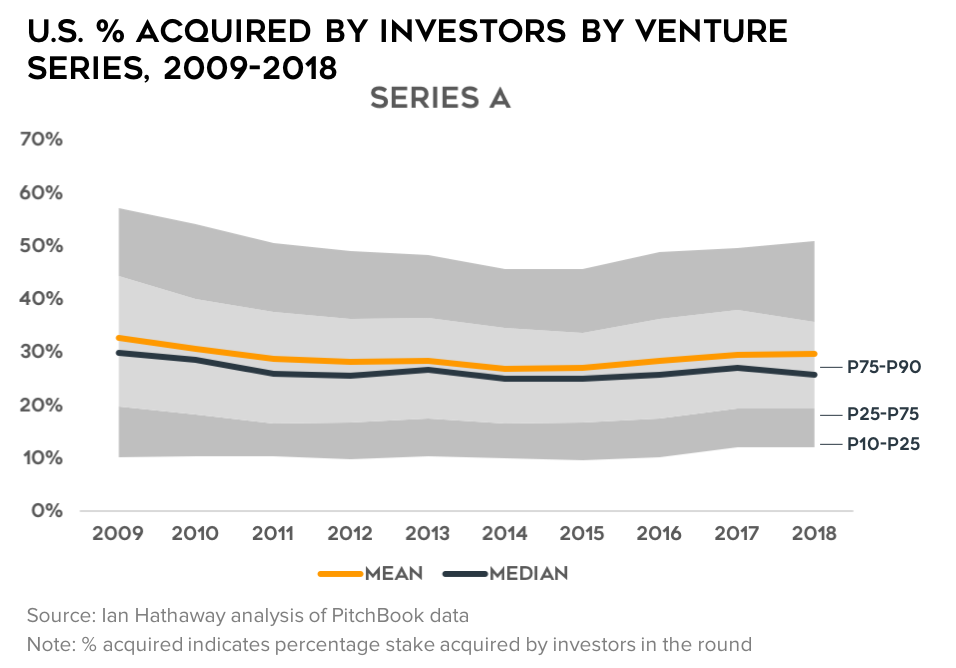
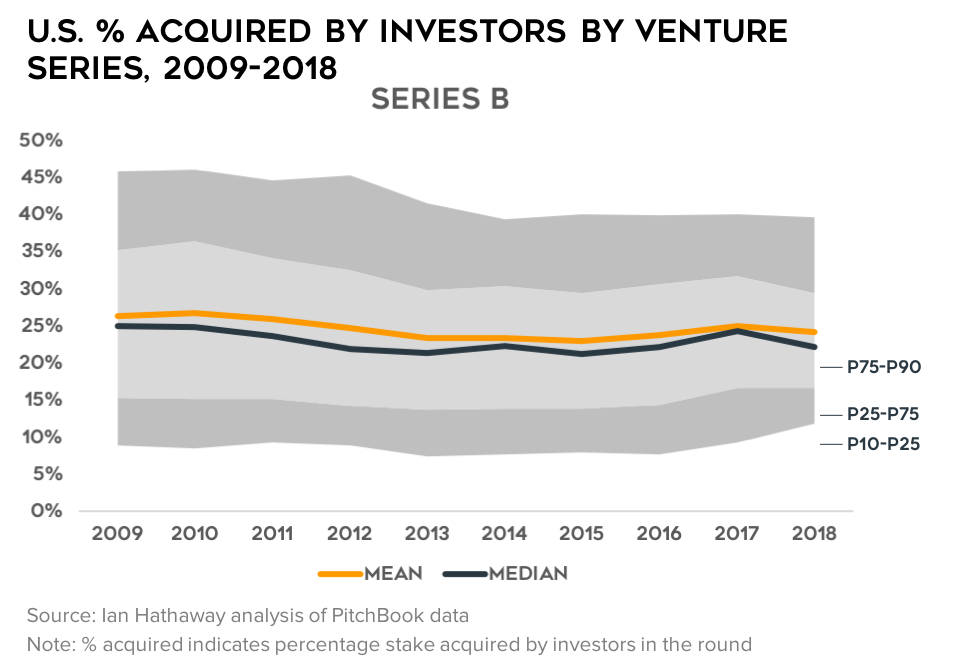
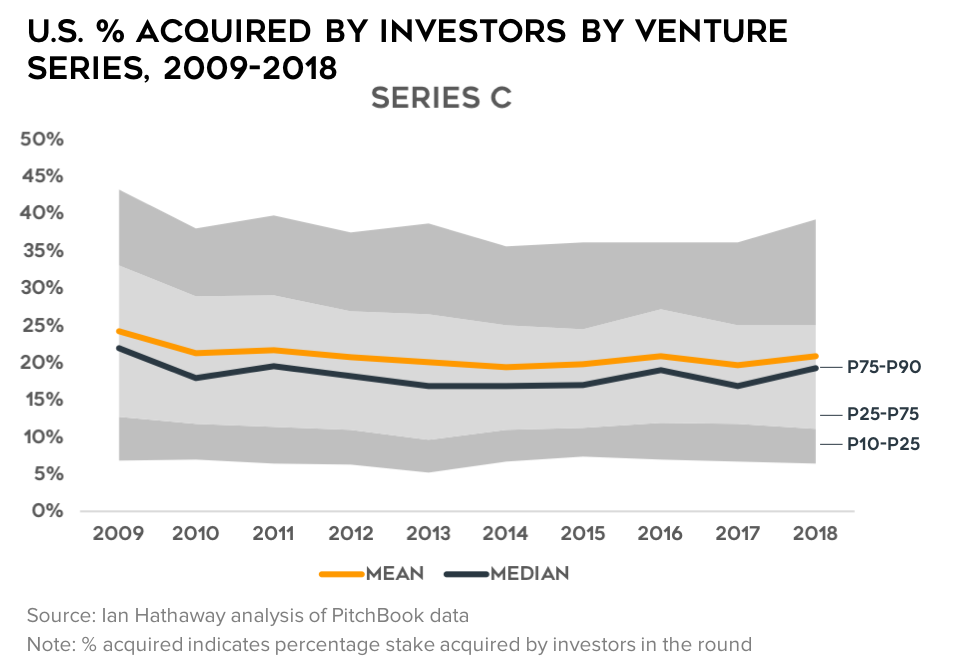
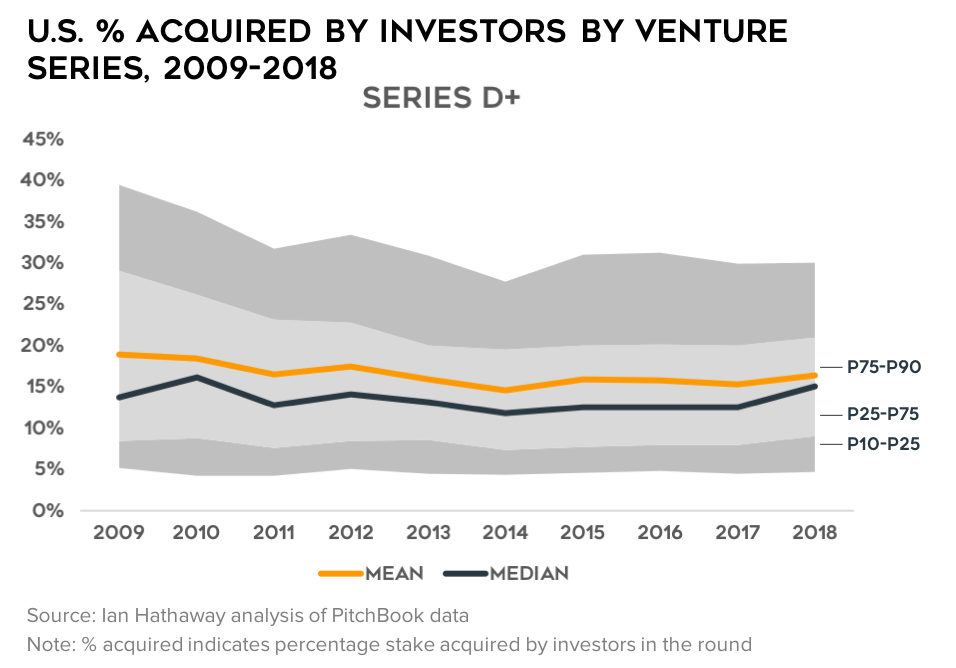
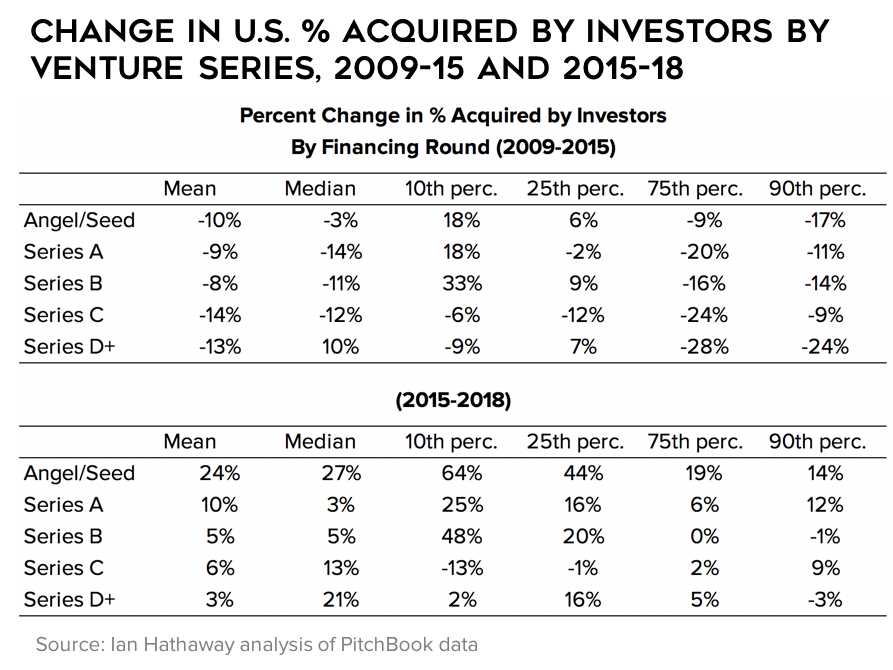
At the remaining stages, investor stakes are holding relatively steady or in some cases, even falling slightly. At the very least, they are not increasing, and the distribution of shares acquired appears to be tightening.
Seed Funds Have Trended Down Since 2014
So far, the evidence points to supply-side conditions explaining the slowdown in early-stage venture deals—that’s not the whole story of course, but the data seem suggestive that it is an important factor. As one more data point, below I present data on fundraising by vintage and fund size (small funds are focused on early-stage companies, and so on).
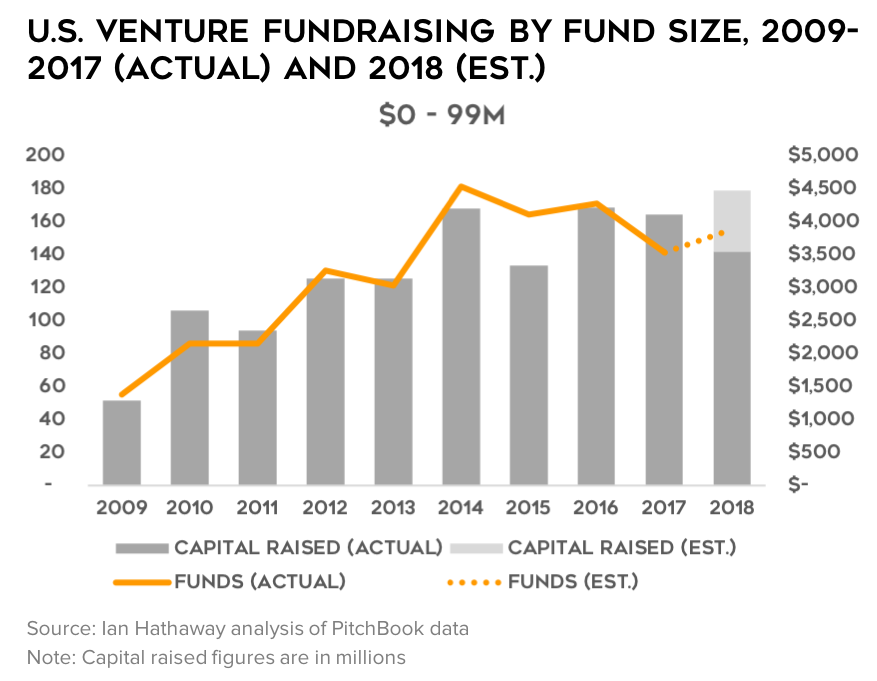
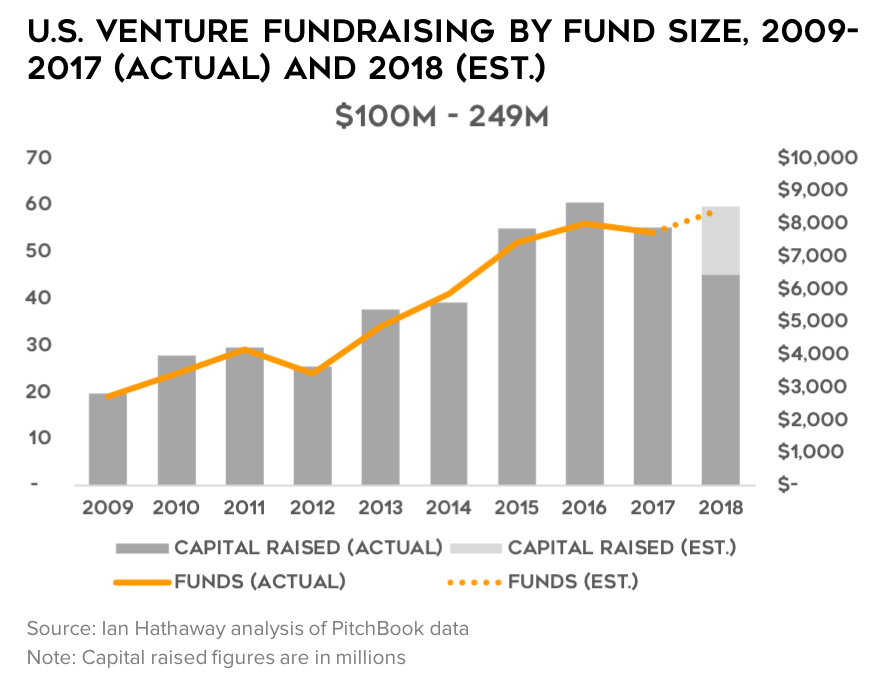
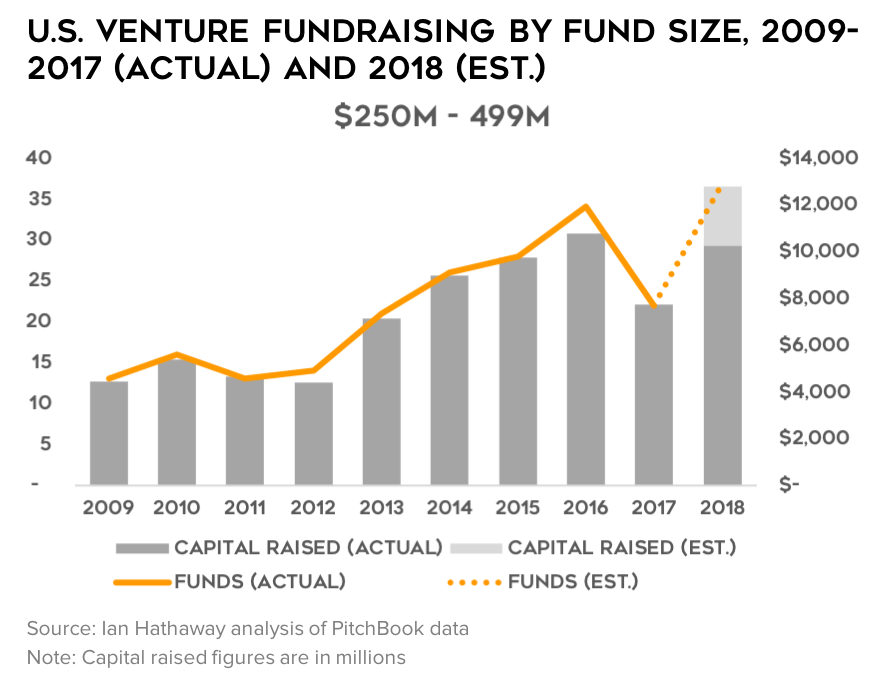
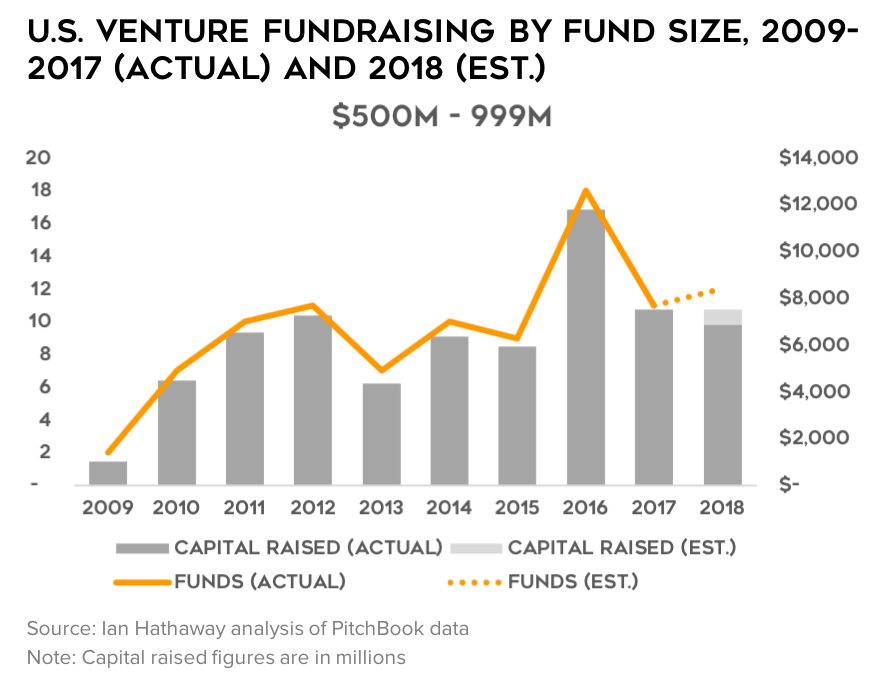
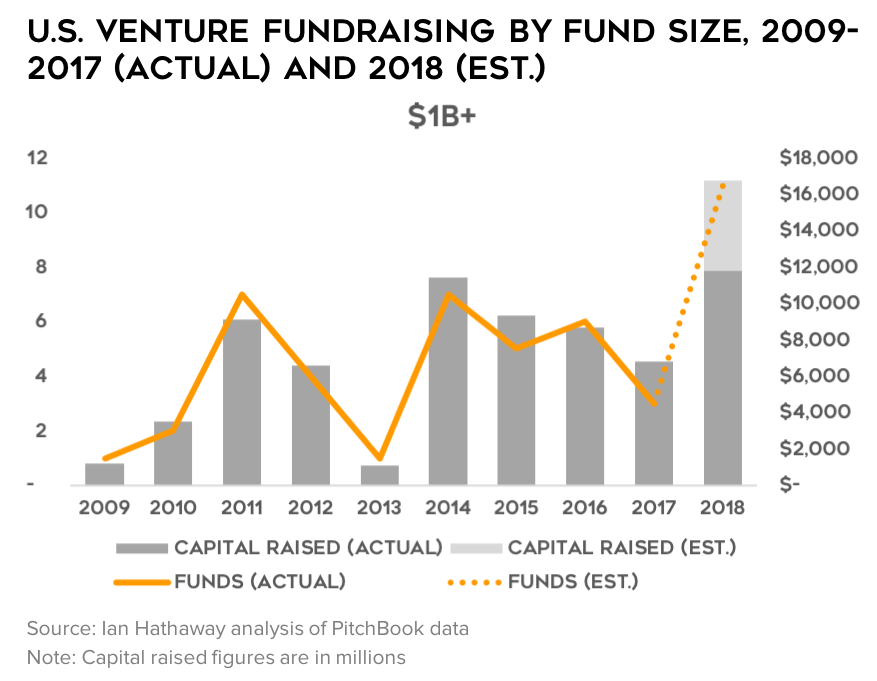
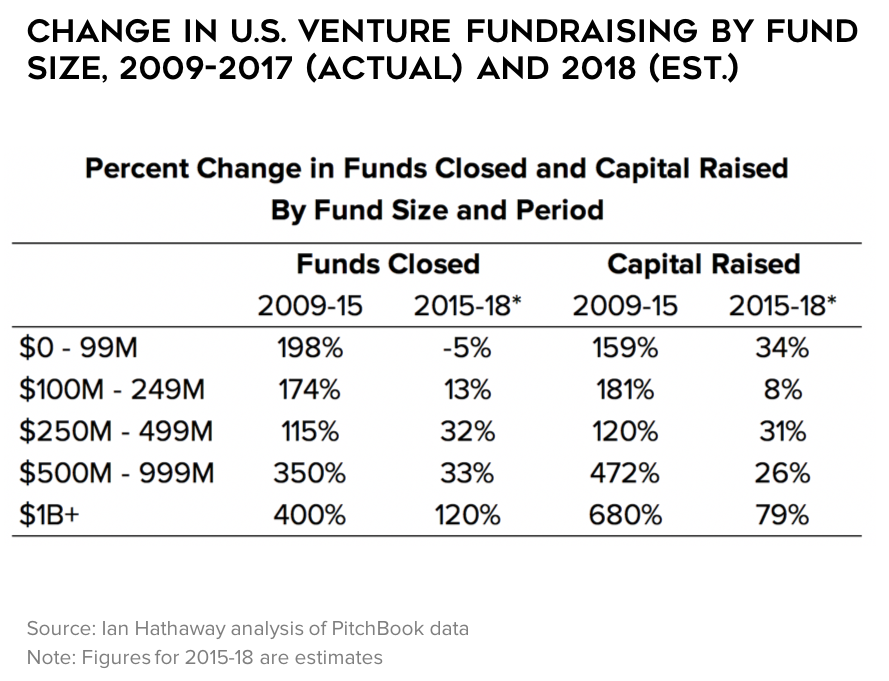
Here again, the evidence shows that while venture fundraising in general has slowed after a period of rapid acceleration, the downshift has been greatest for the smallest funds—those focused on early-stage companies. In fact, for the less than $100M group, the number of funds raised is down—that is consistent with everything else we’ve seen before. (As a side note, PitchBook recently published a fundraising report that shows the smallest funds—those below $50M are in an outright collapse the last few years).
What Does it Mean?
It’s unclear what this all means, but for me, the evidence points to supply-side conditions explaining at least part of the slowdown in early-stage venture deals—fewer companies are getting funded early on, and those that do are exhibiting signs of greater investor leverage in those deals (lower valuations multiples; increased share acquisitions). The reasons for this could be many, including a genuine pullback in the market (fewer investible companies) or the sheer necessity for investors to obtain larger stakes early on as ever-larger rounds dilute those positions in the future, among others.
That’s not the whole story of course—the fact that funded companies are raising more also points to demand-side and technology-driven factors as well. However, the story of too much capital chasing too few deals, at least at the early stage, seems to have flipped.
More fundamentally, the data signal to me that a downshift in the number of companies entering the venture-backed pipeline compared with a few years ago is here to stay. From a capital efficiency standpoint, fewer early-stage deals may be a good thing at least in the immediate-term—the Angel/Seed funnel widened more so than follow-on investors could sustainably accommodate. That doesn’t mean another, more permanent expansion won’t occur in the future, but for now, I believe we’re reaching a new normal—one that is well up from the 2000’s but about a quarter to a third below the 2015 peak.
Finally, as someone who studies the geographic proliferation of startup communities in non-traditional areas (ie, not in San Francisco, New York, or Boston), these data points call into question the ability of other regions to seriously compete. Why? We’ve just gone through a big experimentation phase with early-stage deals reaching a wider number of companies and cities. However, what’s emerging from that as the dust begins to clear, is that scale—even at the very early stages—is what matters. In winner-take-all markets, the stakes are higher, and the pressure to capture only the best and the brightest (and most experienced, particularly at scaling!) global talent will only increase. At present, for better or worse, those resources are located in a very small number of cities.
Having said that, I do believe these cities are at a breaking point in terms of feasibility for startups to affordably attract and retain talent, and for mid-career professionals with young families to comfortably live. There simply isn’t enough technical, managerial, and entrepreneurial talent to go around in the presence of major tech giants in these cities. Something has to give, and a new model of distributed innovation is likely to take shape—one whereby founding or leadership teams may be located in one city, while technical talent is placed somewhere else. By all accounts, this trend is already well underway.