
Last month, I published an analysis in the Harvard Business Review on the gig economy and employment in San Francisco. Yesterday, the folks at HBR were kind enough to post an interactive piece of the analysis.
The Gig Economy Is Real If You Know Where to Look
A number of reports in recent weeks have stressed that employment effects of the so-called gig economy—contract workers on software platforms such as Uber and AirBnB—have been overstated. At minimum, these reports indicate, any increase in gig economy employment hasn’t shown up in the aggregate statistics—at least not yet anyway.
But my analysis tells a different story, showing that the impacts can in fact be seen if you look more deeply at the data and in the right places.
Is America’s High-Tech Jobs Machine Slowing Down?
This article originally appeared at Engine.is
Yesterday, the Bureau of Labor Statistics released its much anticipated jobs report for the month of September–more than two weeks late because of the federal government shutdown. Maybe lawmakers were trying to do us a favor because this wasn’t a great report. The unemployment rate ticked down to what is still an unacceptably high 7.2 percent, while employment grew just enough to keep up with population growth. In fact, the employment-to-population ratio remains stuck in about the same place it was nearly four years ago. These are not signals of a robust jobs recovery.
Because I’m interested in employment, economic progress, and the technology sector as a key driver of growth, I used this occasion as an opportunity to look at recent employment trends for this high-value segment of the economy. What I found surprised me.
Figure 1 shows that since peaking at an annual growth rate of 3 percent in September 2011, employment growth in the high-tech industries has steadily slowed to about 1.6 percent two years later. This matches the employment growth seen across the entire economy but falls below the rate seen for the private sector.
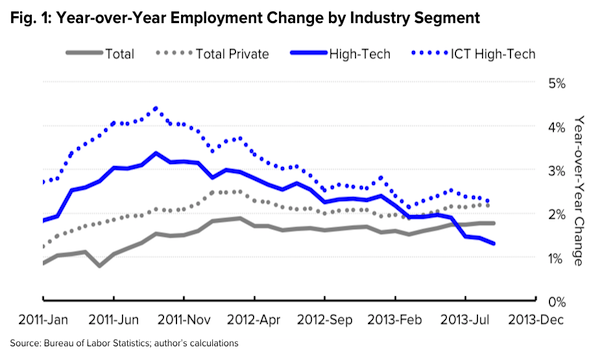
This trend was even more pronounced for the ICT segment of high-tech, which includes firms in computer hardware and software, information services, and Internet infrastructure (this excludes the pharmaceutical and aerospace manufacturing, and engineering and scientific R&D services industries included in the broader high-tech sector). The year-over-year ICT high-tech job growth rate eclipsed 4 percent in mid-2011, but has since fallen to 2.3 percent.
Another way to look at the high-tech workforce is by occupation–particularly because we define the high-tech industries by their concentration of workers in the STEM occupations of science, technology, engineering, and math. Since nearly 44 percent of all STEM workers are employed in the high-tech sector, that leaves millions of additional technology-oriented workers employed in other industries to look at.
In that spirit, Figure 2 shows the year-over-year percentage change in employment for the STEM occupations versus all occupations since the beginning of 2011. Because these data are noisy, I also include a data filter to establish a more visually accessible trend.

Here, we see a fairly similar trend: growth, but a slowdown in that growth. Despite a sharp uptick in recent months, the overall trend for these highly-technical high-value jobs is a clear slowing of growth, and convergence with the anemic growth rates for all occupations across the entire economy.
To get a sense of how these trends fit into other measures of economic vitality, I took a quick glance at equity price performance and venture capital investments. It’s a little bit of a mixed bag, but these measures do not contradict what the jobs data show. For example, S&P tech stock indices have slightly underperformed the broader S&P 500 index in the last two years, and after adjusting for inflation, venture capital investmentshave been flat.
Economic output data–which measure an industry’s contribution to GDP or national income–are too lagged to analyze here, but that data could help us understand whether it is the tech sector that is slowing down, or if it has been able to continue producing with fewer workers, with less investment, or at lower valuations.
While pinning-down exactly what is happening requires a more thorough analysis than is offered here, any slowdown in this segment of the economy would be problematic: the tech sector fuels innovation, its goods and services make other sectors more productive and improve the lives of consumers, and it is a critical source of national income.
I have previously documented the high-value nature of technology workers, the pervasiveness of the growth potential in this segment, and the secondary economic benefits they can bring to a region. We simply cannot afford a slowdown in our high-tech sector or its workforce–particularly as the U.S. economy continues to grind out another jobless recovery.
It’s All Relative: STEM Workers are in High Demand
This article originally appeared at Engine.is
Background
As the immigration reform debate heats up, so too has the rhetoric. One issue that has generally received broad support is the idea of expanding visas for high-skilled foreign workers—in particular those in the STEM fields of science, technology, engineering and math. Such support is based on the view that there aren’t enough qualified native-born American workers to fill demand for these roles. It also comes from the acknowledgment that employment in these fields is critical to economic growth, making them a national priority.
Despite this, some critics have voiced concerns about expanding visas for STEM workers, arguing not only that there isn’t a shortage of STEM workers, but in fact there are too many of them. Expanding high-skilled work visas, they claim, would push native-born American workers out of key technological occupations and reduce the wages of those who remain in them. Such claims are certainly outside the mainstream, but they have been taken seriously enough to appear recently in the Op-Ed page of the New York Times, the Washington Post, the Wall Street Journal, and most recently, the Atlantic.
So, which is it? Are there too few or too many STEM workers in the United States? It can’t be both. Since the truth has important implications for thousands of workers, startups, and the economy, we had better get it right.
The “we have too many high-tech workers” hypothesis is flawed because it is informed by an incomplete set of information. It also lacks common sense. The aforementioned articles rely upon a November report and a report published last week by the same think-tank, both of which point to tepid inflation-adjusted wage growth in computer and math sciences (CMS) fields—a subset of STEM—as definitive evidence of an abundance of labor supply in those professions.
The fact that inflation-adjusted wages grew slowly during the last decade lacks important context. Quite obviously, there were two economic recessions during this period—one of which was the worst contraction since the Great Depression. Both were followed by “jobless recoveries,” or prolonged periods of low employment growth after the economy has begun to grow again.
At minimum, a more relevant question is: how did wages in the CMS fields, and by extension STEM, grow relative to other professions? Looking at just one side of the story is the intellectual equivalent of concluding that the Cincinnati Reds lost last night because they only scored 2 runs. They actually won, because the team they played, the St. Louis Cardinals, scored just 1 run. Context matters.
A more complete and responsible analysis would look at relative performance as well as a broader set of measures to determine labor market “tightness”—a term that applies to areas where potential shortages may exist. A tight labor market would have some or all of these qualities relative to others: rapid employment and wage growth, low unemployment, and a high prevalence of job vacancies.
One final note before we get started: because this debate is taking place in the context of immigration reform for high-skilled workers, whenever possible the data here will be restricted to workers with at least a bachelor’s degree.
Wage Growth
Economic theory says that if shortages existed, prices (wages) would adjust upward until supply (workers) met demand (employers). But the reality is much more complicated. For example, wages adjust slowly and workers must learn new skills—especially for technical roles like in STEM. Still, it’s an important measure for assessing labor market tightness.
The chart below shows how the inflation-adjusted median wage has changed since January 2000 through 2012, for three groups of workers—those in the STEM occupations, those in the CMS subset of STEM, and those in all occupations outside of STEM.

The median wage in STEM and CMS occupations grew by an inflation-adjusted 3.5 percent and 4.0 percent respectively. That amounts to average annual growth rates of around one-third of a percent. Ouch.
But let’s take look at this in context: it’s been a very rough twelve years. As I mentioned before, there were two recessions—one of them the worst economic contraction since the Great Depression—followed by two jobless recoveries. The fact that there was wage growth at all during this period might actually be impressive.
Compared with workers in other fields, wage growth for STEM and CMS workers was actually quite robust. The inflation-adjusted median wage for all occupations outside of STEM fell by 5.5 percent during the same period, for a decline of half a percent each year on average.
Employment and Unemployment
Beyond wage growth, there are a few other measures to consider when analyzing labor market tightness—here we look at employment growth and the unemployment rate before turning to job vacancies afterward.

This chart shows employment growth since January 2000 for college-educated workers in the STEM, CMS and non-STEM categories. Employment in the non-STEM occupations increased 31.3 percent, for an average annual gain of 2.3 percent. STEM fields performed even better, growing 41.6 percent or 2.9 percent per year on average—that’s about one-third more growth than non-STEM. The CMS subset blew the others away—more than doubling non-STEM growth as it increased by 83.1 percent or 5.2 percent annually on average.
This chart shows the unemployment rate for each of our occupational groups during the same time period. The unemployment rate shows the number of people without a job, but who are willing and able to work, and are actively looking for a job (the unemployed), as a share of the total labor force (the unemployed plus the employed). In this case, the occupation assigned to an unemployed person would be the one they held in their last position.
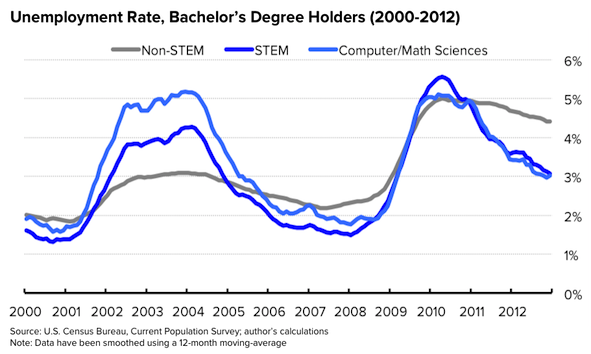
As the chart shows, unemployment rates for college-educated workers of all varieties have been quite low over the last twelve years. The rate for STEM, and especially CMS workers, spiked during the dot-com boom—highlighting the job losses that occurred in that segment of the economy. Important to note, however, is that after peaking unemployment in STEM and CMS fell sharply. This indicates the ease with which unemployed workers in those fields were able to find new work—highlighting their relative value to employers.
The three rates peaked at about the same level during the Great Recession, though STEM and CMS unemployment has fallen sharply since mid-2010; declining by about 2.5 and 2.0 percentage points respectively during that two-year period. Unemployment for workers outside of STEM has only declined by about half a percentage point during the same period. Overall, the evidence here is more mixed: STEM workers seem to face higher volatility while unemployment for non-STEM workers rises less during recessions but also falls slower in recoveries. Even so, the STEM rate has fallen sharply in the last year.
Job Vacancies
Perhaps the most important measure for assessing labor market tightness is the ability of employers to fill open positions. If labor shortages exist, it would be difficult to fill open positions—openings would remain vacant for extended periods or discouraged employers may not even bother posting them at all. Since the reasons for not filling a job are complex, and even if they weren’t, data are elusive, the next best option is to compare the number of open positions with the number of workers available to fill them.
Here, we look at two ways of presenting that data. One caveat first—the job vacancy data used here aren’t available by level of educational attainment. Therefore, we are unable to restrict this portion of the analysis to workers with a bachelor’s degree or more. As a result, the differences here between STEM, CMS and non-STEM may be somewhat overstated.

In a market with an abundance of available labor, the ratio of unemployed per job opening would be high—a large number of workers would be competing with one another for a smaller number of jobs. Where the labor market is tight, this number would be low—in other words demand is outstripping available supply. While the reality is more complicated, this is still a very good way to estimate the relationship between demand and supply.
As the data make clear, the market in STEM and CMS fields is much, much tighter than for fields outside of STEM. At the end of 2012, there were 2.4 CMS job openings for each unemployed CMS worker and 1.4 STEM openings for each unemployed STEM worker. That’s a lot of job openings for each unemployed worker to potentially be matched with. The exact opposite was true in non-STEM fields, where 4 unemployed workers battled for each job opening.

If you’re unconvinced that unemployed workers are an adequate measure of available labor, we can extend that definition to include workers who are currently employed in those roles. Recall that the unemployed plus the employed constitute the labor force. Here, we use the labor force as a measure of labor availability for STEM, CMS and non-STEM workers.
This time, the number of job openings is in the numerator and is expressed as a share of the labor force. This is often referred to as the job vacancy rate. Here, a bigger number would indicate a tighter labor market, showing that there are a larger number of job openings relative to the ability of the labor force to fill them. A smaller job vacancy rate would indicate the opposite.
We still see a similar story, though less pronounced: there is a larger number of job openings relative to available labor to fill those roles in STEM and CMS, compared with fields outside of STEM. The difference between this chart and the prior one likely has to do with a more rapidly declining unemployment rate and higher employment growth in STEM and CMS—both positive signs.
Conclusion
Wage growth for STEM and CMS workers with at least a bachelor’s degree has been more robust during the last twelve years than it has been for workers outside of these fields. Not only did wages grow at the median for these fields while wages in all other professions fell substantially, that growth also reached workers with a broader set of income levels.
Looking at other measures, available labor to meet job openings has been scarcer for the STEM and CMS fields, employment growth has been more robust, and unemployment has fallen to lower levels. The evidence is more mixed when it comes to unemployment, but overall the consistency across measures and the magnitude of differences point to tighter labor markets in these fields.
In fact, according to performance thresholds to assess labor market tightness outlined in a comprehensive review of the literature published by the Bureau of Labor Statistics, the CMS labor market is tight on each of three metrics (employment, wages, and unemployment). STEM is tight on two of three (wages and unemployment) and goes halfway on the third (employment). The BLS report doesn’t provide threshold criteria for job vacancies because these data weren’t available at that time.
This highlights a few important points worth making. Firstly, providing definitive evidence of the existence or nonexistence of a labor shortage in any profession is difficult, both because what constitutes a shortage can be broad based and because the appropriate data can be elusive. It’s irresponsible for researchers to claim there is an oversupply of STEM workers because of one metric taken outside of its proper context.
To be clear, the approach here does not claim that there is a shortage of workers in STEM and CMS fields. Instead, it shows that these labor markets are tighter than others based on a broad set of measures. At minimum, it is a clear rejection of the notion that we have too many high-tech workers in the United States—an argument that not only fails on evidence, but common sense as well.
Secondly, and perhaps most importantly, the argument about whether there is or is not a true shortage of STEM workers misses the entire point. Recent research has shown that foreign-born STEM workers increase employment and wage opportunities for high-skilled native-born American workers (STEM and non-STEM). In other words, these workers are complementary to, not substitutes for, one another. Foreign-born STEM workers are important contributors to productivity gains, which fuel economic growth and national prosperity. And because these workers tend to be employed in sectors of the economy that compete globally, if the United States doesn’t capture the talent and therefore growth, someone else will.
Let’s get our facts straight, and in context, as we move forward with immigration reform. Sure, foreign worker programs like the H-1B visa have a number of problems and need rethinking. So does our education system. But let’s fix those, not shut our doors to high-skilled foreign workers based on poor economics. That would be throwing the baby out with the bathwater, and in the process, shooting ourselves in the foot.
Debunking the Myth of the Startup Hub
This article originally appeared in The Wall Street Journal
A common misconception in the United States is that high-tech firms exist only in a few cities that coalesce around the coasts. The reality couldn’t be further from the truth. Yes, it’s true that places like Boston, Seattle, San Francisco and Silicon Valley are important hubs of high-tech activity, but so are places like Boulder, Colorado, Huntsville, Alabama and Wichita, Kansas.
The Bay Area Council Economic Institute published a report in December that details recent trends of high-tech employment and wages throughout the United States. The report found not only that high-tech jobs are a critical source of employment and income in the U.S. economy, but also that growth in the high-tech sector has been increasingly occurring in regions that are geographically and economically diverse.
As evidence of this, one of the report’s findings was that a statistically significant relationship could not be established between the concentration of high-tech jobs in a region and whether employment in the high-tech sector had grown in the last half-decade or the last year. In other words, high-tech jobs have been growing outside of the well-known tech hubs.
Regions should want high-tech firms in their communities because they pack a lot of economic punch. This can be illustrated by the multiplier effect, whereby the creation of one high-tech job in a region creates an additional 4.3 jobs in the local services economy of the same region in the long run. Compare that with the manufacturing sector, long a darling of regional development authorities. It has a local multiplier of 1.4. Although this is quite large, it is still just one-third the size of the local multiplier stemming from high-tech.
So, what does all of this have to do with startups? The short answer is that high-tech firms are an important source of entrepreneurship in the U.S. economy. While this probably isn’t a controversial statement for most, the actual magnitude of the high-tech sector’s share and distribution of startups remains largely unmeasured. This is a topic my colleagues and I are currently researching and intend to publish in a companion report to Technology Works within the next few months.
For now, let me provide a few data points from our preliminary analysis. Though high-tech businesses existed in 98 percent of U.S. counties in 2010, new high-tech companies were born in 62 percent of counties during the same year. What is more, high-tech startup growth is occurring in regions outside of the traditional tech hubs. For example, 70 high-tech startups were formed in Fort Collins, Colorado in 2010, while 88 were started in Baton Rouge, Louisiana and 162 in Columbus, Ohio. All marked increases in excess of 60 percent over the year. A total of 117 major metros increased high-tech startups by at least 20 percent in 2010 from the year prior, and 50 did so compared with five years earlier.
This analysis of the high-tech sector will help inform how business formation and job creation patterns for innovative and growth-oriented “startups” differ from those for “new businesses” generally. As innovation pioneer Paul Graham noted, startups have fundamentally different business goals and should not be lumped together with new businesses broadly. Research by economists at the University of Chicago backs this assertion, finding that three-quarters of nascent entrepreneurs have no intention of innovating or growing substantially.
Differentiating potentially high-growth startups from other new businesses is important for public policy too. Ronnie Chatterji, a Duke University business school professor and former Obama White House adviser, points out that potentially high-growth firms like those in the high-tech sector command an entirely different set of policy priorities. According to Engine Advocacy, a non-profit that connects startups with policymakers, reform is required in areas like education, immigration, intellectual property, and financial regulation. State policymakers can create investment-friendly environments through tax incentives and regulatory reform.
To summarize, high-tech jobs are important to the economy and are growing in a wide and diverse set of regions. The same is true of high-tech startups. The issue of whether high-tech startups are able to survive outside of well-established tech hubs is one of many important questions that we are currently working to answer in our research. We hope to have that answer to you shortly. Stay tuned.