
One of the drawbacks of venture capital databases is that they are dynamic. Information trickles in, often with significant time lags. This is especially true at the earliest stages, where rounds are often unannounced and many startups are too small for anyone to notice. It’s a structural challenge that I’m not sure will ever be fully resolved.
The underreporting and time lags associated with very early deals has become further compounded in recent years. Many startups in Silicon Valley and other leading startup hubs have increasingly relied on unpriced rounds (SAFEs or convertible notes) for their first or even second rounds of financing. Because these rounds are unpriced, they don’t appear in a company’s cap table until after it has raised a priced round later (and further, announced the deal—see above).
Combined, there are structural and cyclical reasons that the underreporting of very early venture rounds is especially acute now and fraught with severe reporting delays. This matters because people want to understand the market trends in near real time.
To test how much of a problem this has become, I grabbed data on first financings from an analysis I did last year and compared them to first financings from a data pull today. The chart below shows the number of first financings in US companies between 2005 and 2017, as reported 14 months ago in August 2018 (light bars) and as reported today (dark bars, residual). The green line shows the percentage increase in reported deals between these two periods.
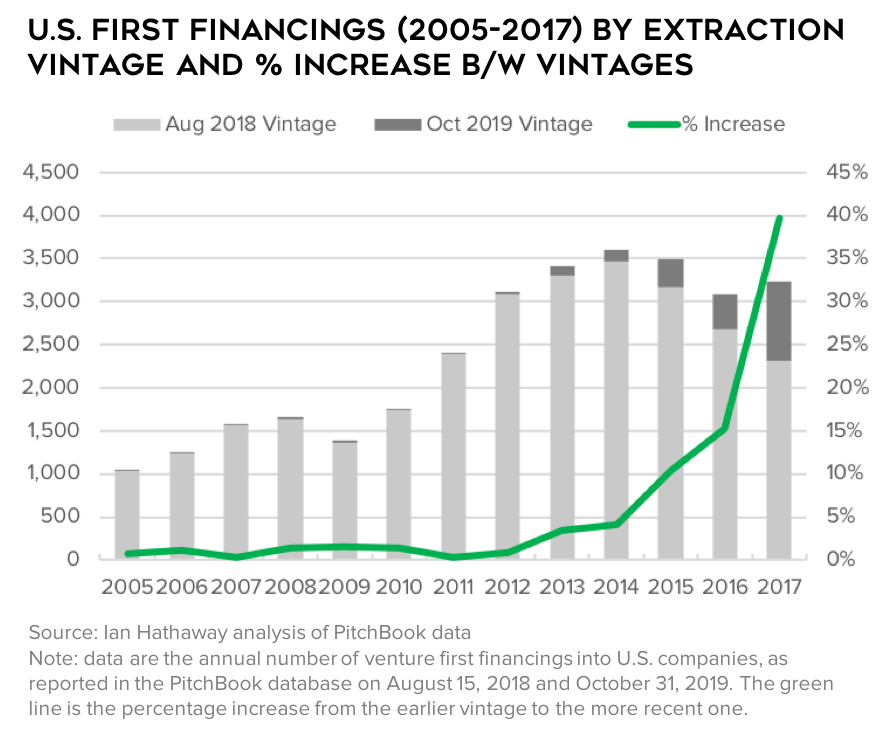
As the data show, historical revisions were minimal throughout most of the period, but began steadily rising from six years ago before becoming enormous in the latest year the comparison could be made. Annual revisions between the two vintage pulls were around 0%-1% for the years 2005-2012, before climbing to 3%-4% in 2013-2014, 10%-15% in 2015-16, and a eye-popping 40% in 2017.
Said differently, if just 14 months ago in August 2018 you reported first financings for the year 2017 (which I did!), you would have been off by more than 40% compared with today (!!!)—a number that will surely rise over time as first round deals continue to be reported and the PitchBook database is updated to reflect them.
These revisions are so large that they have the ability to overturn entire analyses. In that work from 14 months ago, I erroneously reported a continued drop in first financings for 2017—a steady annual decline that occurred after a peak of first financings in 2014. But as today’s data pull (the October 2019 Vintage) shows, 2017 was actually an increase from 2016 (though still down compared with 2014).
What might this say about the current state of venture first financings? Well, if we assume a similar revision cycle 14 months from now compared with the one I just walked through, 2018 would have been a record year for venture first financings instead of being about flat compared with 2016-2017, and well below the 2014 peak. Check back next year to see how accurate this forecast turns out.

Now the big question is to what extent these massive revisions are being driven by the proliferation of unpriced rounds, a continuation of the inherent underreporting and lagged reporting of venture deals, or improvements in data collection occurring over time. It’s probably a bit of all of these. But my hunch is the first factor is driving up the size of the errors in recent years.
Regardless, the major lesson here is this—be cautious about reporting venture activity too recently. In just a few months, a number of different data vendors and other analysts will be producing year-end reports on venture activity for 2019. They will all be wrong. While this is not new, as I and others have noted in the past, what may be changing is the magnitude of these errors. This will be especially acute at the earliest stages of venture activity (first rounds), where the majority of deals occur.