
Last week, The New York Times published an article arguing that a “wave of venture capitalists is heading to quieter, less-expensive locales, where they are helping fund start-ups.” The article supported this claim by pointing to three venture capitalists who left Silicon Valley and launched funds in other places. One of them, Mark Kvamme, left Sequoia Capital to found Drive Capital in Columbus, Ohio; but that was back in 2013.
I don’t doubt that some venture capitalists have left The Valley to start funds elsewhere. However, The Times is massively overselling the reality. It is already well-advertised that venture-backed startups (the recipients of venture capital) are highly concentrated by geography. However, venture capitalists (the ones investing in startups) are concentrated by geography even more. Let’s take a look at the data.
The chart below illustrates the geographic concentration of venture capitalists along four dimensions: firm counts, active portfolio companies, assets under management (value of portfolios), and dry powder (venture capital available to be deployed). I aggregated the four measures by U.S. metropolitan area according to each active venture capital firm’s headquarters location. The data are presented as a share of the U.S. total.
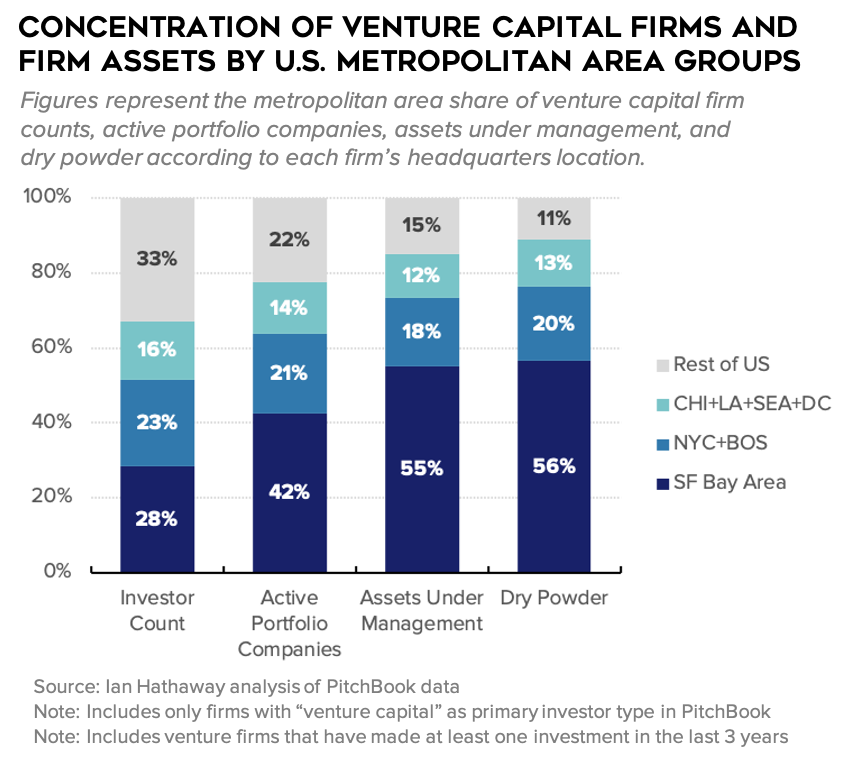
To no surprise, the San Francisco Bay Area (including the San Francisco and San Jose metropolitan areas) dominates: 28 percent of active venture capital firms in the United States are headquartered in this region, yet 42 percent of active portfolio companies, 55 percent of portfolio company value held, and 56 percent of venture capital available to be deployed (“dry powder”) are attached to Bay Area venture capital firms.
Moving further down the list, the New York and Boston metro areas are headquarters to 23 percent of active U.S. venture capital firms, and to 21 percent of all venture-backed portfolio companies, 18 percent of the total value of portfolio companies, and 20 percent of dry powder. Chicago, Los Angeles, Seattle, and Washington (the headquarters of New Enterprise Associates) round out the leading metro areas for venture capitalists.
Combined, these seven regions (or eight metropolitan areas since the Bay Area includes two of them), account for two-thirds of the nation’s venture capital firms and a staggering 89 percent of venture capital available to be deployed (“dry powder”). That outshines the already considerable geographic concentration of venture backed companies.
The next chart shows the geographic concentration of the eight most active locations for venture-backed startups. Seven of the metros are the same as above, with one exception—San Diego replaces Washington. Venture deals, capital invested in those deals, and two outcome metrics—exits (IPOs, M&A, buyouts) and exits of $100 million or more—are highly concentrated at the top, but less so than venture capitalists. Forty-two percent of venture deals and 21 percent of capital invested occurs in places outside of the leading eight metropolitan areas. The shares of total exits and large exits fall in the middle.

So far, we’ve looked at the geographic concentration of venture capitalists and venture-backed startups at just the top of the distribution. To demonstrate concentration across all geographies simultaneously, I calculate a Herfindahl-Hirschman Index (HHI) for each of the measures presented. HHI (the sum of squares of shares for each measure for each metro area) is frequently used to calculate total market concentration. HHI values, which are abstract, aren’t important here. Instead, focus on the relative differences. Higher HHI values indicate greater concentration.

Across the measures, venture capitalists—whether by firm counts, or weighted by active portfolio companies, portfolio value, or deployable capital—are more concentrated geographically than are key measures of venture-backed startup activity and outcomes. Venture firms are nearly 50 percent more concentrated than are venture deals (a proxy for venture-backed startups). Dry powder is similarly 50 percent more concentrated by geography compared with the amount of venture capital going into companies.
These findings may not come as much of a surprise to people in the world of startups and venture capital, however, some of the magnitudes might. It is well understood that the Bay Area dominates most things and in particular for venture capital firms. I expected the Bay Area to dominate, but I admit that I am a little surprised by how much it actually does—especially when compared with the likes of New York and Boston.
For the general public, including federal, state, and local policymakers throughout the country who are searching for ways to stimulate entrepreneurship and venture capital in their jurisdictions, these data points may be nothing short of shocking. After all, it’s not every day you see one-quarter of the businesses and more than half of the value in any industry concentrated in a single geographic area. But that’s the story of venture capital and Silicon Valley—one that goes back many decades.
My objective here isn’t to invalidate The Times article. I thought it was interesting and encouraging. A greater spread of venture capitalists around the country may occur in the coming years as a critical mass of entrepreneurs required for the local provision of that business model takes shape in more places. At the same time, it’s important to ground those possibilities in reality. I like to test claims with data. And, as the data show, the venture capital industry is extremely concentrated by geography. There will always be a tension between the demand for venture investors in more places and the supply of them. Many locales do not and will not have sufficient entrepreneurial activity to support local venture firms. But more will; and the article points to a few of them.